The 4 Machine Learning Models Imperative for Business Transformation
Deploying machine learning models to predict an outcome across a business is no easy feat. That’s particularly true given that data science is an industry in which hype and promise are prevalent and machine learning — although a massive competitive differentiator if harnessed the right way — is still elusive to most brands. There are a multitude of potential hurdles and gaps standing in the way of actuating models into production, including skills gaps (both internally and with vendors or providers) and the possibility that your data or the models themselves don’t possess enough integrity and viability to produce meaningful results.
Initiatives to enact and stand up machine learning-based predictive models to make products and services smarter, faster, cheaper, and more personalized will dominate business activity in the foreseeable future. Applications to transform business are aplenty, but it is highly debatable how many of these predictive models have actually been successfully deployed or how many have been effective and are serving their intended purpose of cutting costs, increasing revenue or profit or enabling better and more sublime customer and employee experiences.
Hi, we are Buckley & Cassidy, and this is a subject that has needed some clarity for quite some time. We’re glad that you’ve found this post, and especially glad that we finally found the time to get it out into your digital hands. To forewarn you, there’s a lot to unpack about machine learning models, and in this post we’re going to do just that…unpack the various elements of setting up and deploying a machine learning model that effectively predicts what’s needed to drive successful business outcomes. Once that foundation is laid, we’ll outline the top four predictive machine learning models every business should operationalize.
Now, even though we advise against skipping ahead as you’ll miss getting skilled up in this most cutting-edge topic, IF you want to jump ahead and dig right into the models themselves, simply click the anchor links below:
- Lead/Opportunity/Conversions Model
- Attrition/Customer Retention Model
- Lifetime Value Model
- Employee Retention Model
In our years of consulting and growing new divisions and companies, there has never been a better time to look at, evaluate and invest in these four machine learning models to help steer new, modern campaigns and initiatives as well as drive insulated innovation and true transformation. The result of having these models in production has led to significant growth figures, and while we won’t and can’t share those figures and details explicitly, we can certainly show you what it may look like for your organization. On top of that, we’ve been so wowed by the results these models have generated that we’re also using them internally as we put the finishing touches on a new product in our Labs division. If, by the end of this post, we haven’t wowed you like these models have wowed us, please reach out. We’d love to benefit from your experience by learning what we should have or could have done differently.
For now, let’s dig in.
What Do Effective Machine Learning Models Look Like?
Before we get into the machine learning models you should be using, it’s important to note the difference between building a model in test, deploying the outputs of a model and assimilating a model into actual processes and business products and services for humans to use. Yes, it’s a complex job, but there’s an even greater, unseen complexity when putting machine learning into practice. As evidence of what we mean, take a look at one of Cassidy’s favorite quotes:
“Kaggle is to real-life machine learning as chess is to war. Intellectually challenging and great mental exercise, but you don’t know, man! You weren’t there!” – Lukas Vermeer
Kaggle is an online community that brings data scientists together to learn from and support each other while tackling major challenges. Even though courses and conversations might facilitate an atmosphere in which you’re forced to do mental gymnastics, they lack one core attribute — the actual emotional, human response consumers have to your brand with everything they experience at each touchpoint.
Moreover, there isn’t a one-size-fits-all approach to machine learning. With so much data at our disposal, it’s often a struggle to identify the focal points of each model to ensure that effective changes are made regarding the business’s goals and strategies. For example, how do you define a canceled customer? Is it someone who you’ve lost contact with after three weeks? Three months? What data points do you incorporate into the model to make strategic business decisions? Basic demographics or descriptive data such as gender, subscription type and residence aren’t going to do much when it comes to making strategic business decisions.
Said another way:
How can you build models that have an impact on the most vital areas of your brand, so that they bring value to your business?
Through the rise of technology, we’ve seen many businesses center their hopes and dreams on leveraging artificial intelligence (AI) as the driving force behind major organizational changes to encourage growth and stand the company up in highly competitive markets. Unfortunately, we’ve also seen a majority of those aspirations falter without the proper frameworks, alignment, rigor and forethought to back them up. Instead of creating “game changer” initiatives, hasty companies often end up with no more than expensive science experiments that have dismal success rates and low “attributable ROI.”
Having the proper frameworks in place ensures that you organically uncover where to start assimilating data and insights from the model into the appropriate processes and organizational materials. In doing so, you’re able to drive growth via digital transformation and economies of scale, bringing to light the metrics and targets around which models should be built. Before any of this can happen, you must lay the foundation for the production of your machine learning models.
Laying the Groundwork for the Production of Your Machine Learning Models
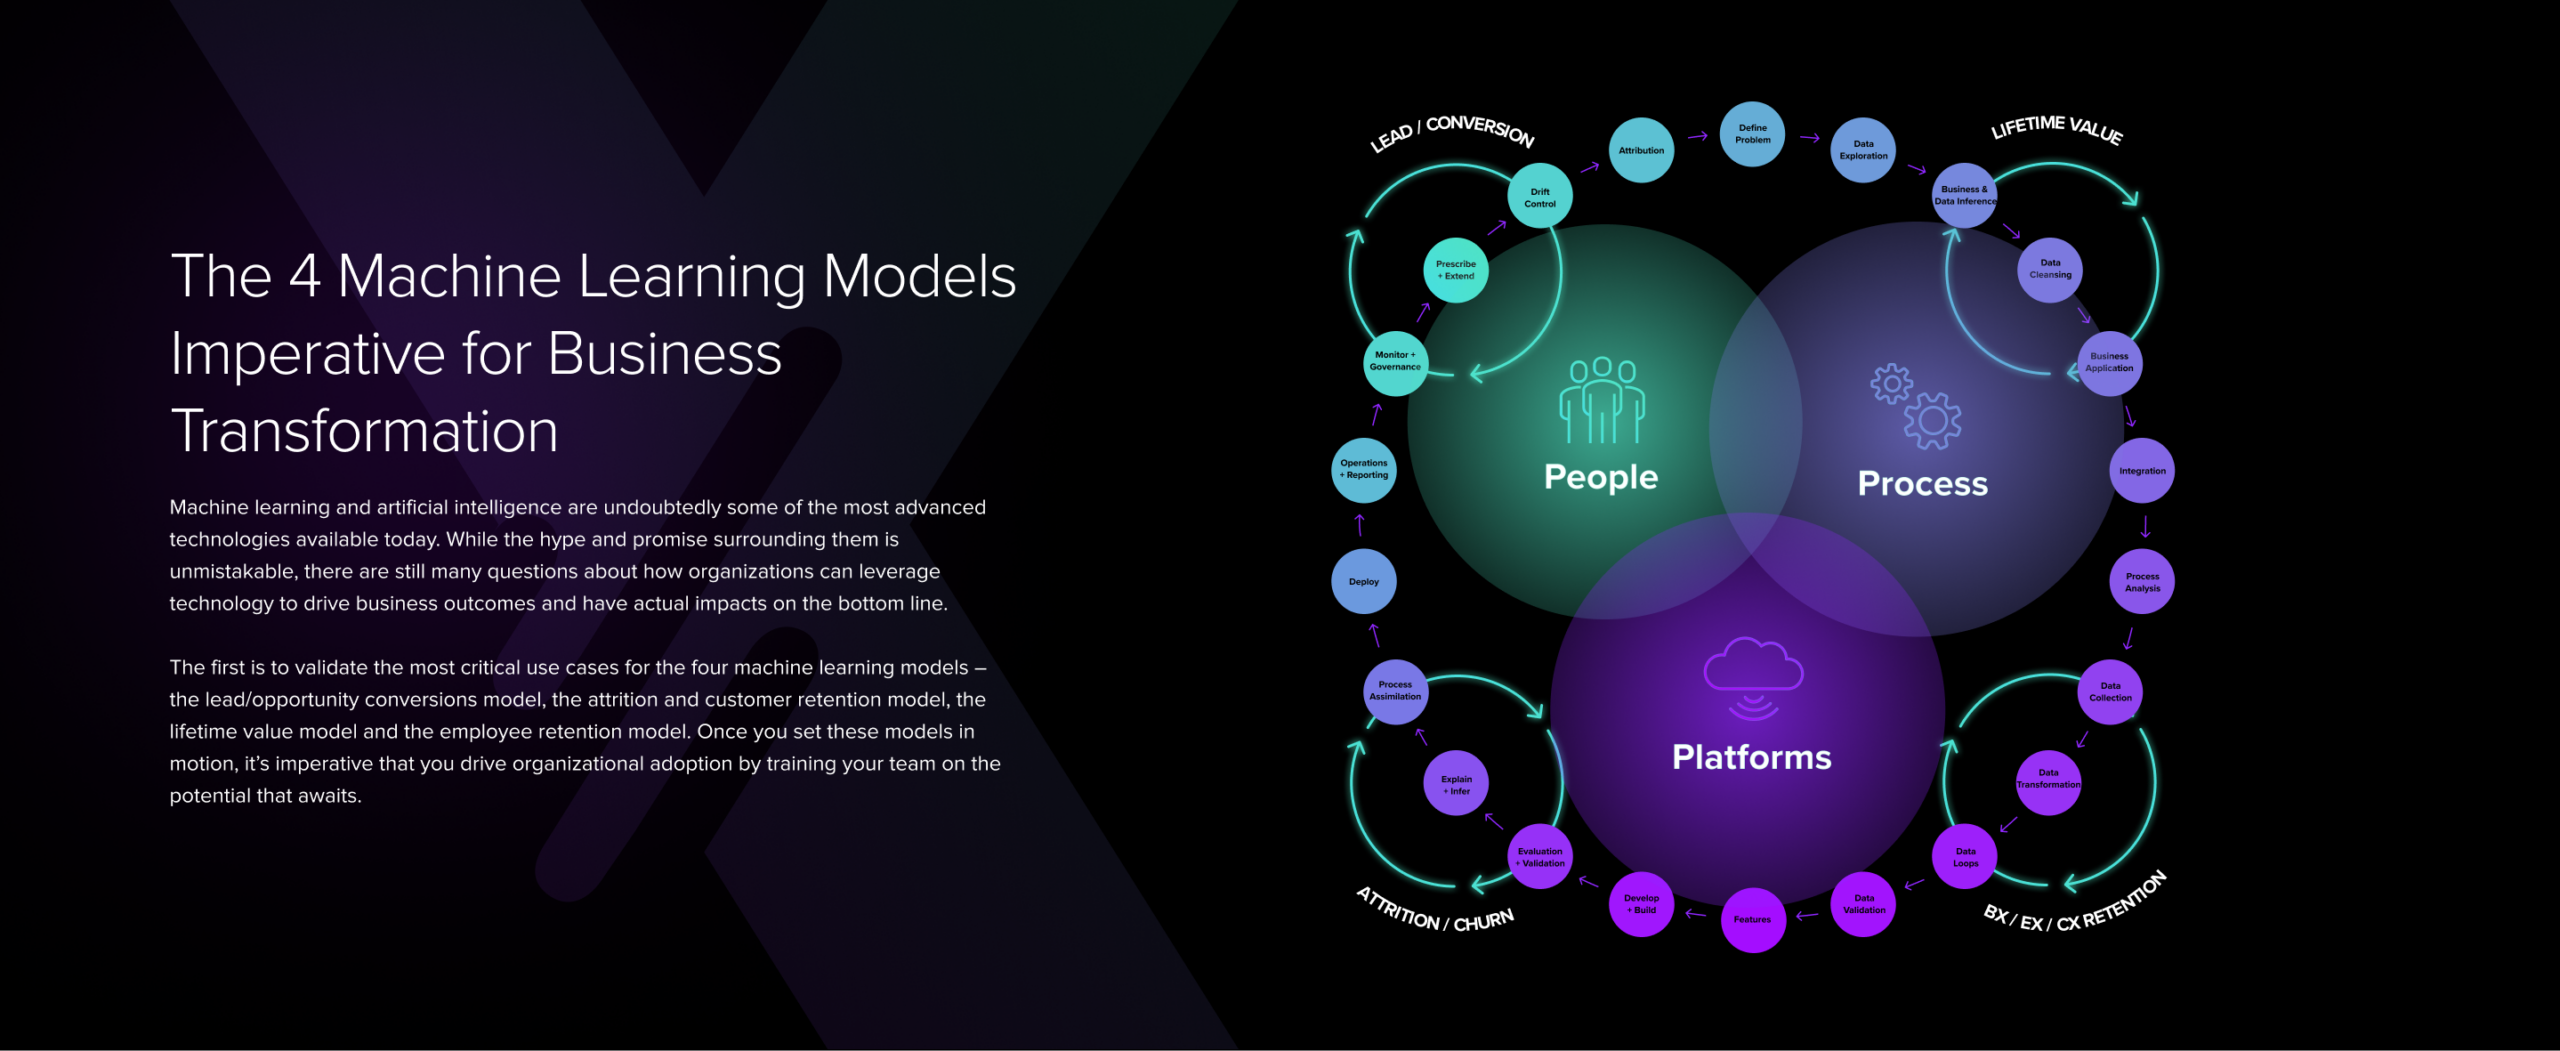
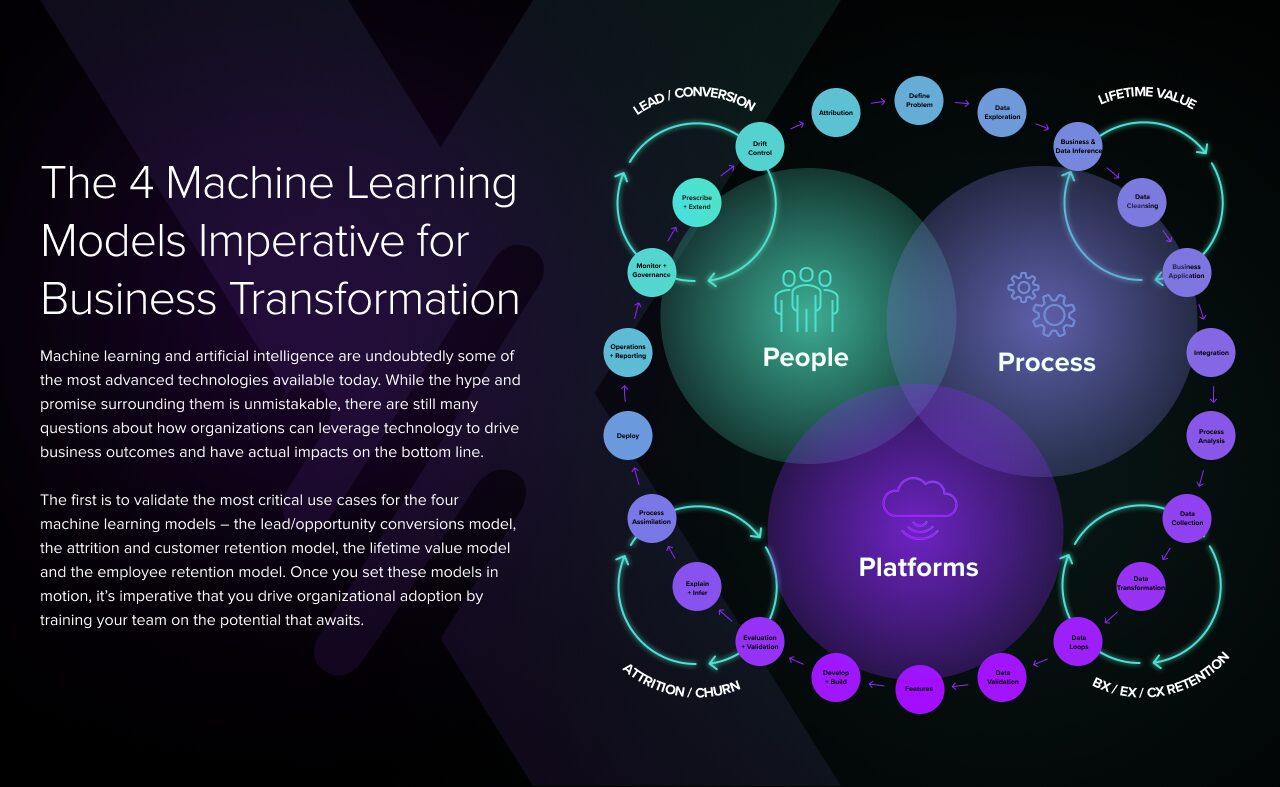
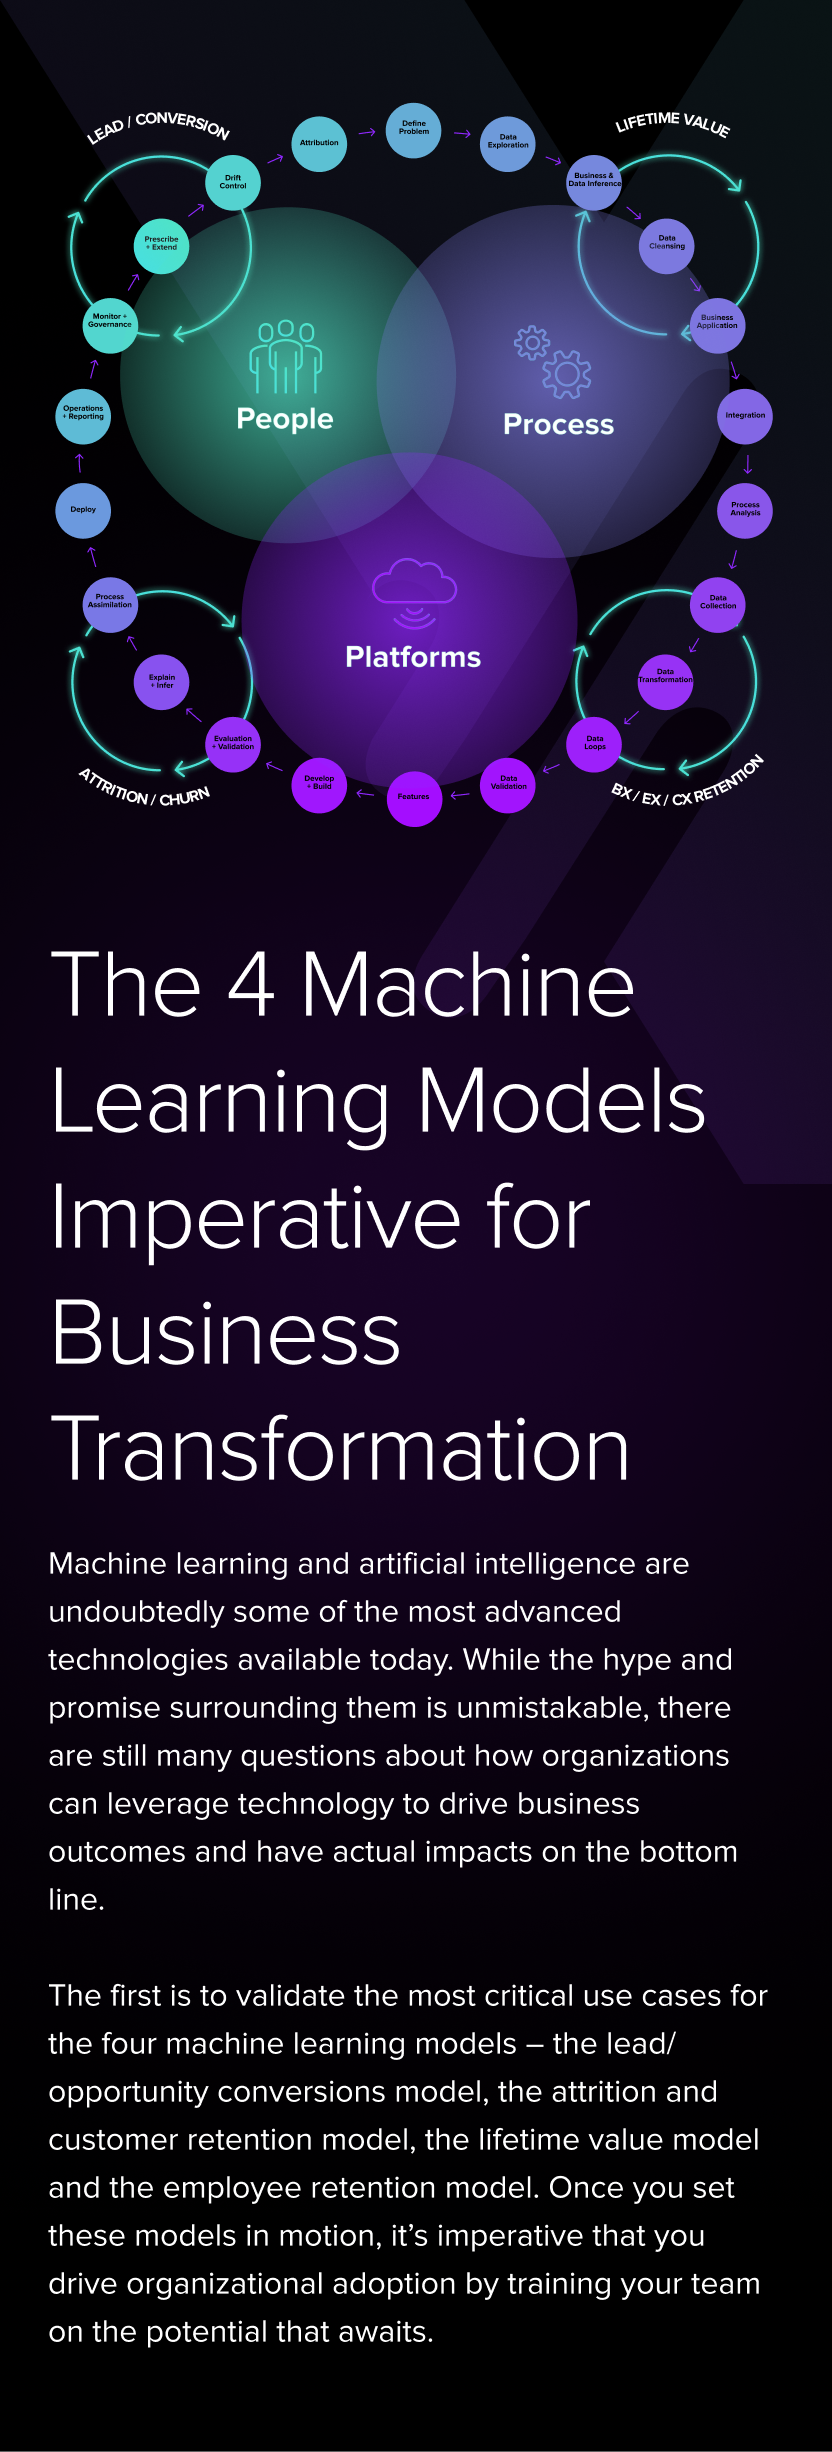
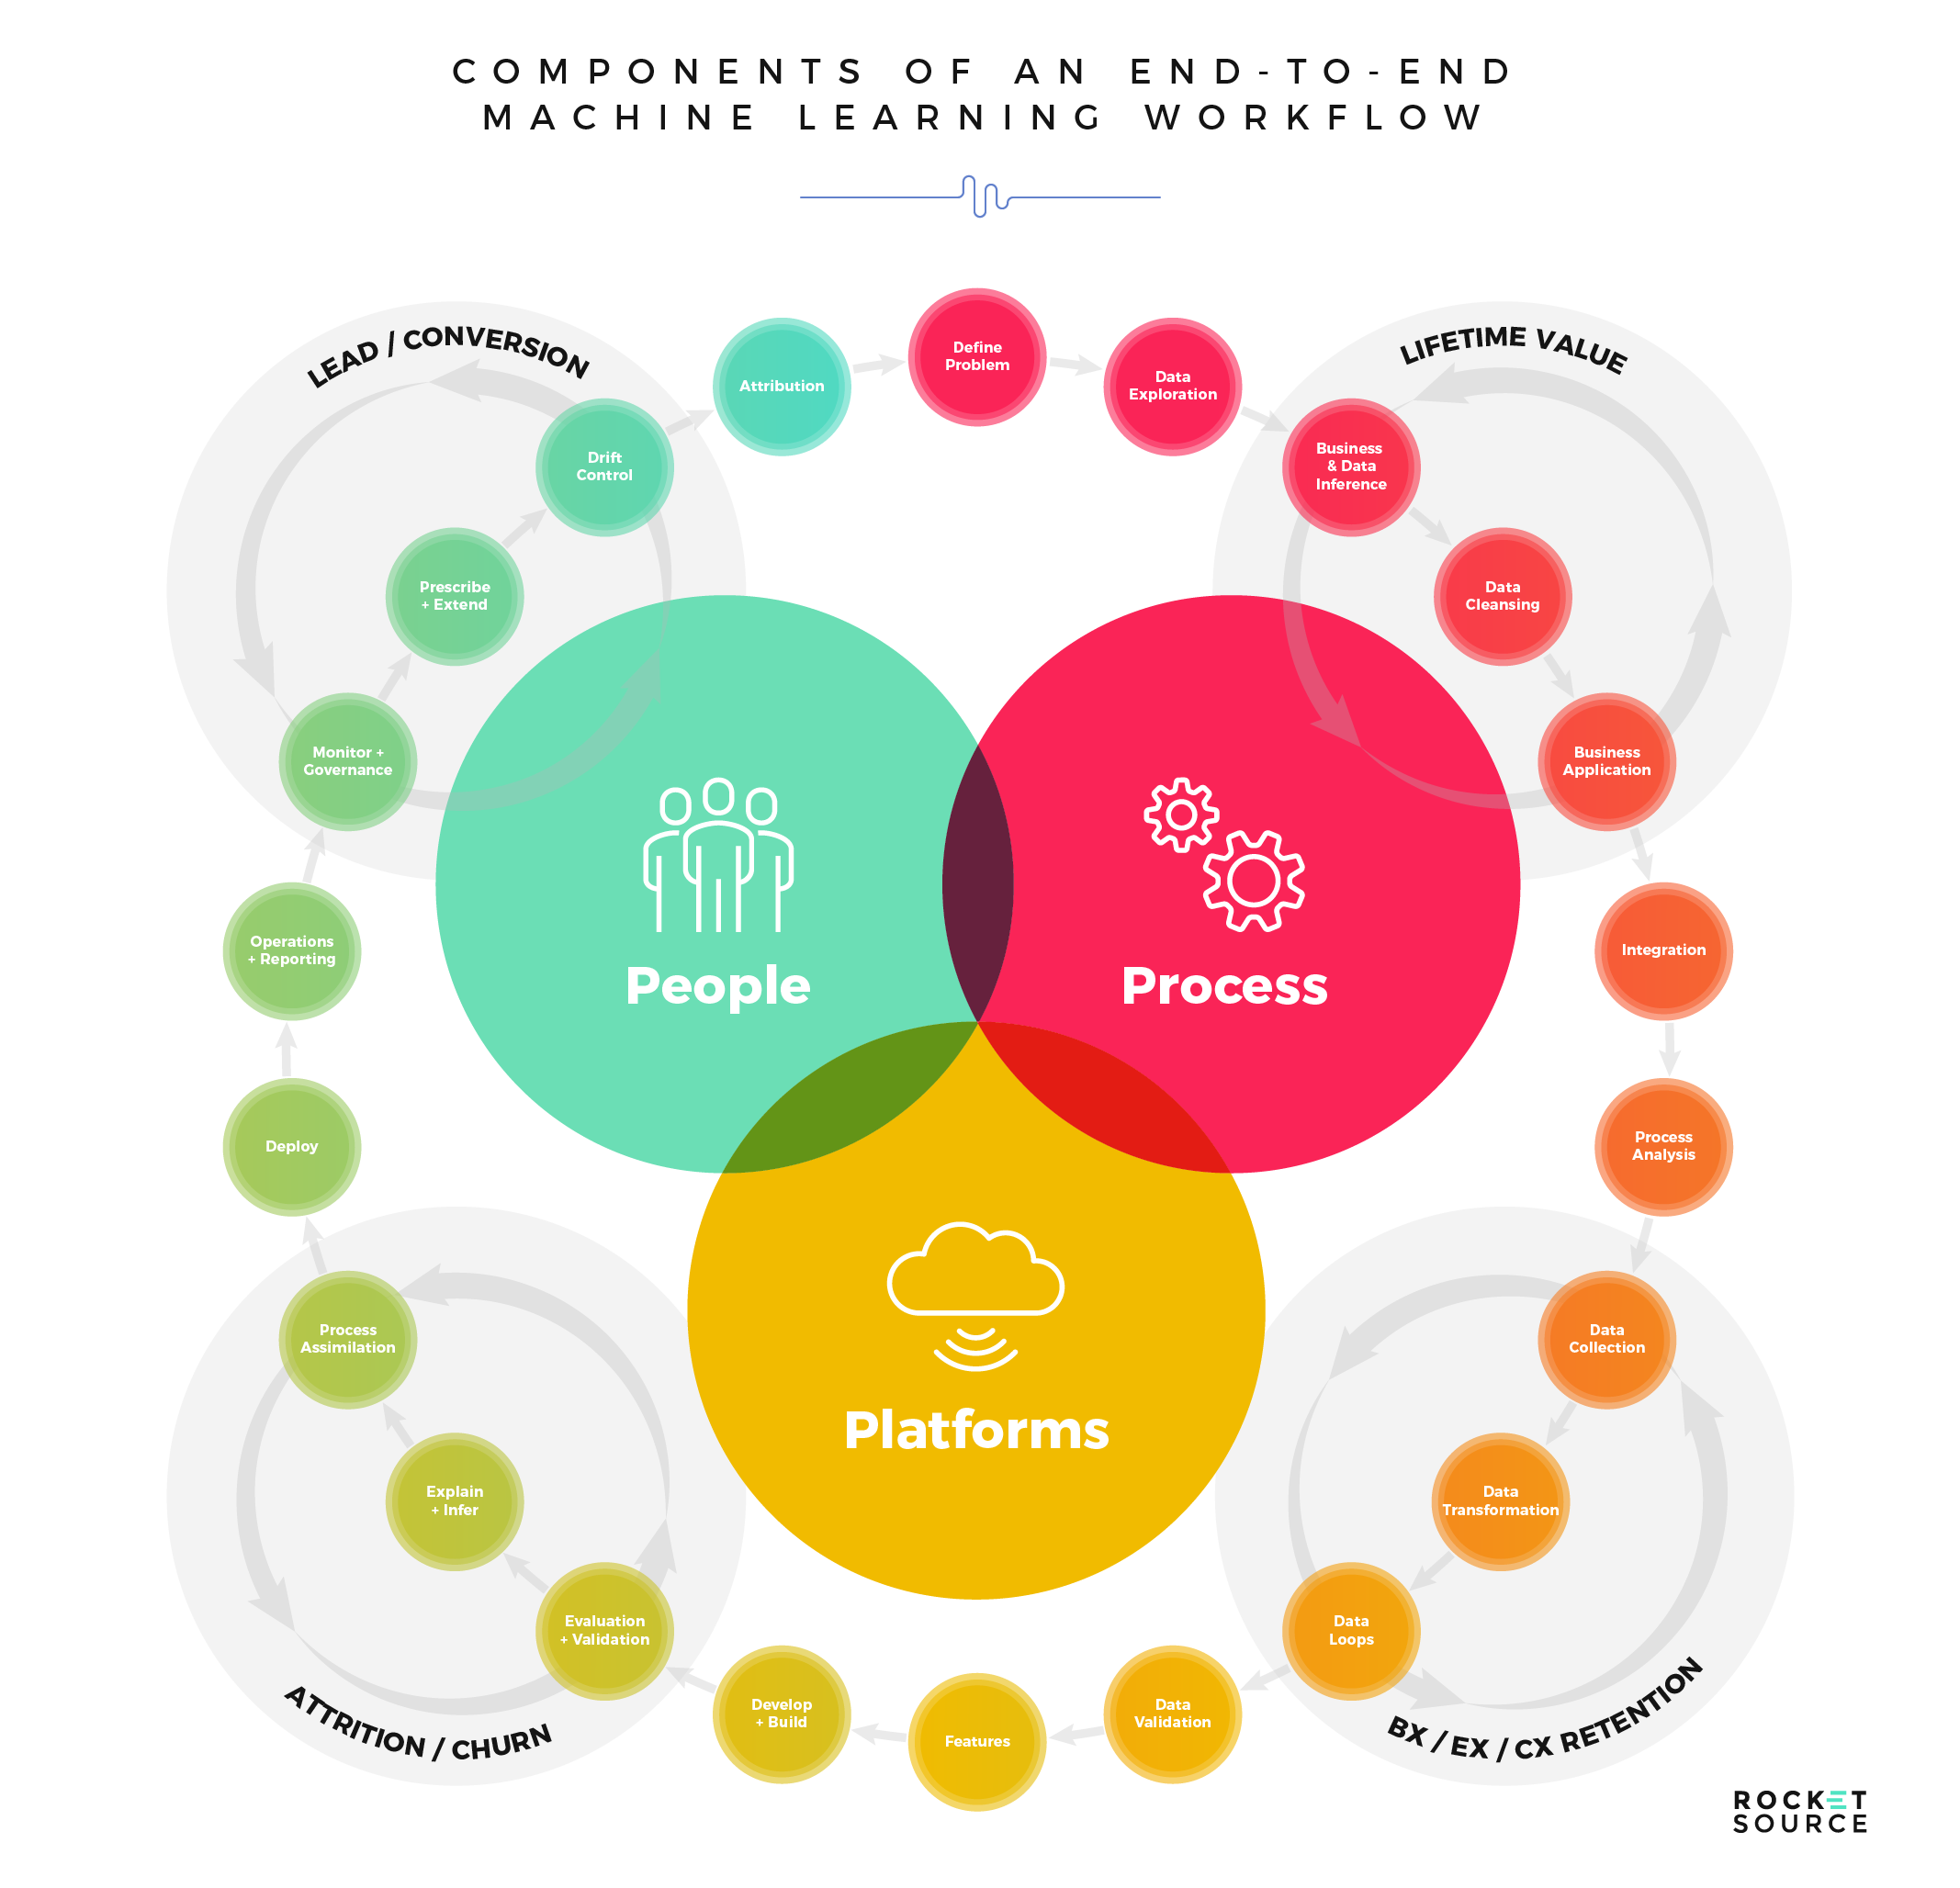
There’s a lot of hype out there about the possibilities of modern technology. After all, the more digital assets and data we have at our fingertips, the more we’re able to ratchet up our insights and move faster and more strategically. Still, despite these digital economies of scale, there’s no silver bullet for leveraging what’s out there. Although technology is getting increasingly sophisticated, it’s often overwhelming. There’s a surplus of assets that can be leveraged to formulate a strategy and roadmap centered around advanced analytics. Where do you begin? We believe it starts with the 3 Ps of your organization — people, processes and platforms.
The 3 Ps have a direct impact on the alignment and interconnectivity of combinatory systems, which include your ability to describe, interpret, explain and control the wealth of information you have at your disposal. Deploying technology without skilled people, sophisticated platforms or effective processes will more often than not lead to models being built but then failing to deliver actionable or valuable insights.
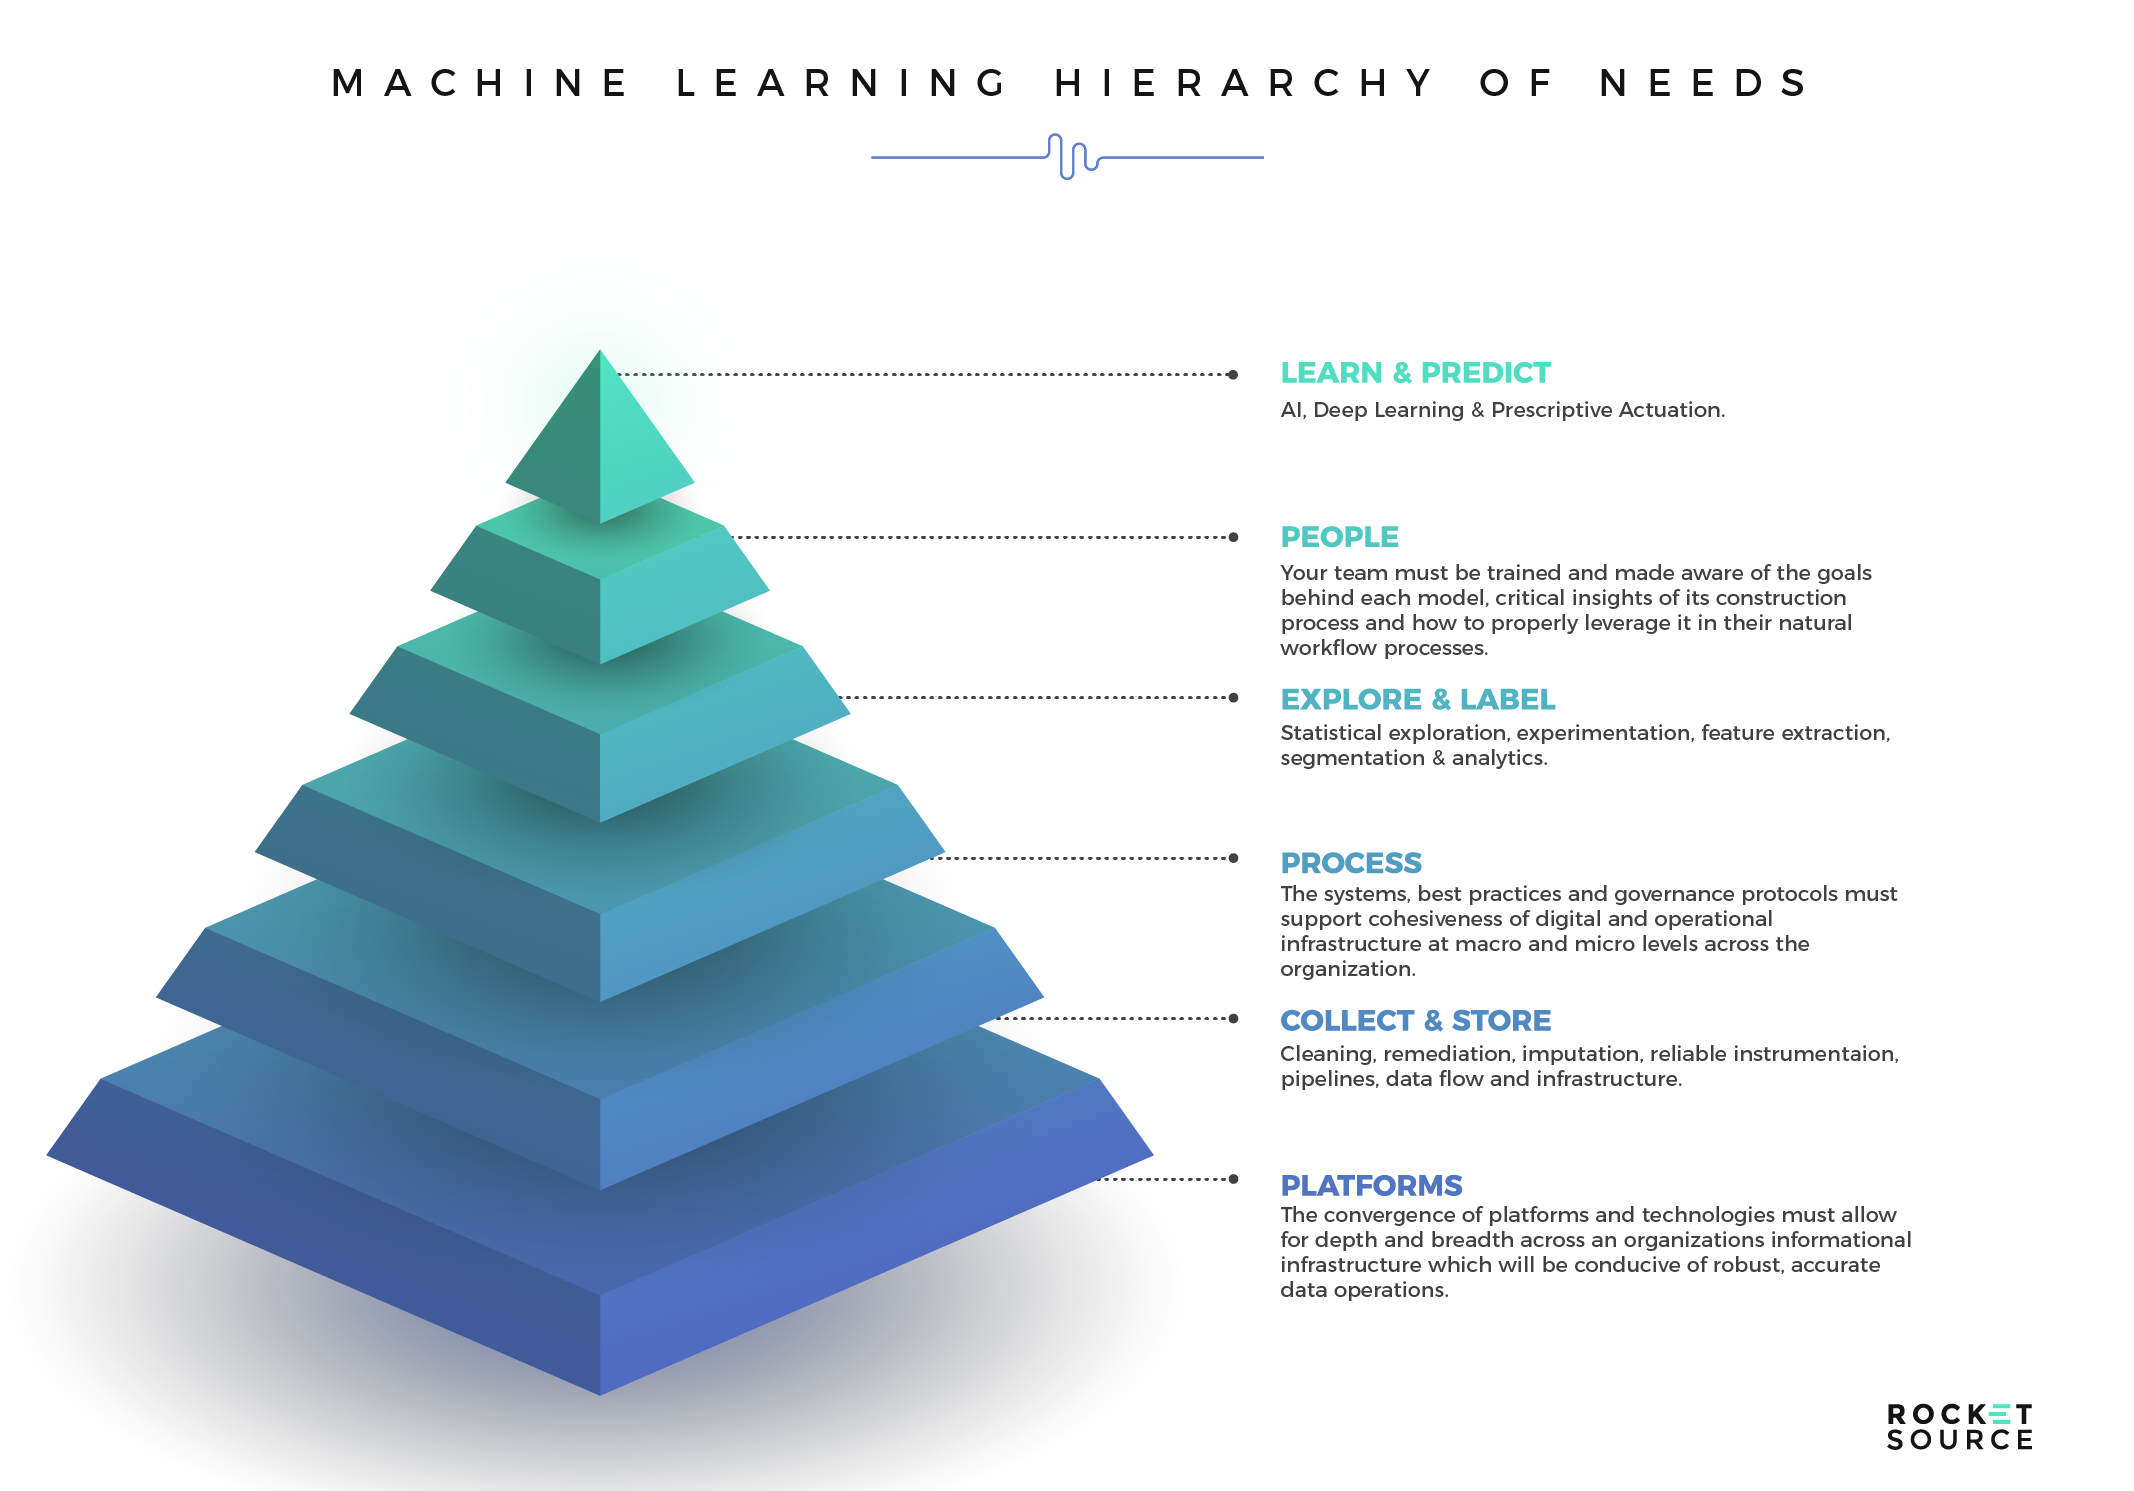
There’s a strict hierarchy of needs for driving machine learning to succeed. At the ground level of that hierarchy are the technology needed to put a new model in motion and the collection methodologies for gathering the necessary data. Too often, this is where organizations start and end, assuming that platforms will deliver actionable insights needed to transform. However, platforms are just the beginning. In order to adapt to today’s fast-paced market, you must also have the proper technology in place to collect and store the necessary data, and the proper processes for delivering clean data to your models. Once your model has that data, it must clean, aggregate, segment and analyze what’s available to deliver a predictive result.
The top two sections of this needs hierarchy are perhaps the most important. In order to leverage sophisticated technology, it’s imperative that you have people who are skilled enough to take the output generated by your machine learning models and translate it into something valuable to the business. Without that progression and skillset on board, it’ll be dang near impossible to fulfill the top tier of the hierarchy — to learn from the data and predict future market behaviors. Your people infuse human insight into the data and make decisions that will tug on the emotional and logical triggers of your target audience.
When done right, this hierarchy serves any business well, regardless of size or industry. We know this with certainty because we have seen it help dozens of organizations drive significant growth by transforming the way they work and helping them insulate their business via advanced digital transformation. Cassidy has years of industry knowledge and more battle scars than most when it comes to building and deploying predictive analytics across the front lines of organizations and Buckley has advised and implemented on data-driven digital transformation and innovation with some of the fastest-growing and biggest brands on the planet. From leading numerous intelligent customer journey mapping exercises to helping organizations humanize advanced journey analytics generated by machine learning models, the common and most sought-after goal is to uncover insulating innovation opportunities and growth potential as well as reduce the costs of doing business with the modern customer of today.
See the image below? We call this the Customer Insights Mapping (CIM) model.
Insights. That’s what every company is after, isn’t it?
This CIM Dashboard is the output of one of our core offerings — a customized (and potentially predictive) journey analytics dashboard which pinpoints the critical areas where companies are succeeding and failing across the entire customer experience. There isn’t a single company in the world that doesn’t want to uncover the precise moments in a customer’s journey where not only an implicit understanding of the customer’s journey is known but where predictive machine learning could add a dynamic competitive and insulating barrier against competition.
Not a single one.
We continue to recognize the need for machine learning models that drive business outcomes. But, without the proper frameworks in place to leverage human insight, you won’t have the people, platforms or processes necessary to learn and predict based on the output from your models. Repeated conversations with clients were the catalyst for this post — to show you how technology can be leveraged to deliver a beautiful end-to-end experience.
When it comes to digital transformation, you can’t rely on guesswork. Instead, you must have the right people and processes in place to take what’s available through the platform and turn it into something valuable for the business.
Using the Right Technology to Build Machine Learning Models
Nearly every business we sit down with is enthusiastic about the idea of pursuing machine learning and artificial intelligence, and is excited about the possibilities associated with them. However, to be ready for any kind of beneficial pursuit, you first need to know which of the model options will best suit your needs.
The technology-specific aspect of a machine learning or AI strategy should center around an organization’s ability to use what’s generated by the models. If a business isn’t equipped to process and benefit from this data, why build these models in the first place? It’s important to note that we are using the term “model” to refer to the spectrum of models out there today. For example, it could be robust, or it could simply mean a rules-based model built completely and unmistakably in Standard Query Language (SQL). Let’s dig in a little further, shall we?
Rules-Based (SQL) vs. Machine Learning
SQL is a basic language used to communicate with databases. In the past, when there was a very limited amount of data available, SQL thrived. As we moved into an era where Big Data is, well…BIG, managing the wealth of incoming data has taken on a life of its own. What worked yesterday will no longer work today. Data management now requires a more sophisticated approach — more sophisticated than what a simple rules-based approach can offer.
Before we jump too far ahead, if you’re not familiar with SQL, here’s an excellent video to provide more context to this discussion:
In the right situation, building advanced machine learning is immensely valuable for adapting to the increased amount of data at our disposal, but in many instances we can benefit from the simple rules-based approach offered by SQL. Let’s look closer at some of the benefits and limitations of SQL when it comes to understanding historical trends, behaviors, patterns and, ultimately, relevant insights.
Benefits of Using SQL
Organizations find a fair amount of value in a robust set of rules-based models for a number of reasons. First and foremost, in an SQL environment queries and their results are easily explainable and decipherable. You don’t need an advanced skill set to understand what’s being conveyed by the model, and disseminating the knowledge gleaned from SQL is simple and straightforward.
It’s also much easier to gain adoption of usage of SQL reporting. That’s because, in many instances, those using the data were likely involved in the performance in some way, shape or form. They already possess a level of context and have some skin in the game, which creates understanding and pre-conception. As a result, those people viewing the data are more open to adopting the insights gleaned and to optimizing processes based on what they’ve learned.
Limitations of Using SQL Exclusively
While there are certainly benefits to SQL, rules-based reporting definitely comes with its limitations. The old adage “garbage in, garbage out” couldn’t be more true in this realm. Labels, dimensions and overall integrity are completely dependent on the state of the data itself. If the data is dirty, whether from mishandling due to a lack of data governance or from poor collection practices, the end result won’t be accurate and could lead organizations down the wrong path.
Further, rules-based models are highly manual and are fixed. As data evolves and time passes, the interrelationships, correlations, etc. throughout the data will change. Still, regardless of this natural ebb and flow, the ability to build dynamic rules that evolve with the data is quite difficult.
Rules-based reporting in the form of SQL is, in large part, rear-facing or historical reporting. And, if we’re honest, even the most “real-time” solutions are historical. For example, a properly configured query could tell you the average number of page views your site had the Sunday evening after you launched a new ad, but it might not be able to help you predict outcomes for future ad launches.
Machine learning answers the challenge of future-facing predictions by using an algorithm to evolve along with the data over time without depending on a predefined set of rules. That’s because predefined rules are just the beginning of how algorithms deliver deeper insights to organizations today. Let’s keep digging.
Statistics vs. Machine Learning
As an organization’s information infrastructure matures, the most appropriate next step is to begin adding advanced analytics. We use the specific term advanced analytics with purpose in this context for two few reasons:
- It assumes migration from historical analytics into current and future based analytics
- It encompasses statistical analysis as well as machine learning
That last point is important. Statistical analysis and machine learning are not one and the same. In fact, depending on who you ask, you may hear some emphatic opinions about the differences between the two approaches. We won’t try to wrap up this ongoing debate in just a few short paragraphs (yeah, even we’re not that brave), but we can try to summarize it for the sake of our audience’s desire to derive more meaning from their analytics and models. You likely do not care whether an optimized set of data-driven processes and protocols are explicitly defined as statistical modeling vs. machine learning or predictive modeling, but you do care how both approaches impact you, so we’ll simplify the differences to help you know what you need to in order to create meaningful analytics and models around your business objectives.
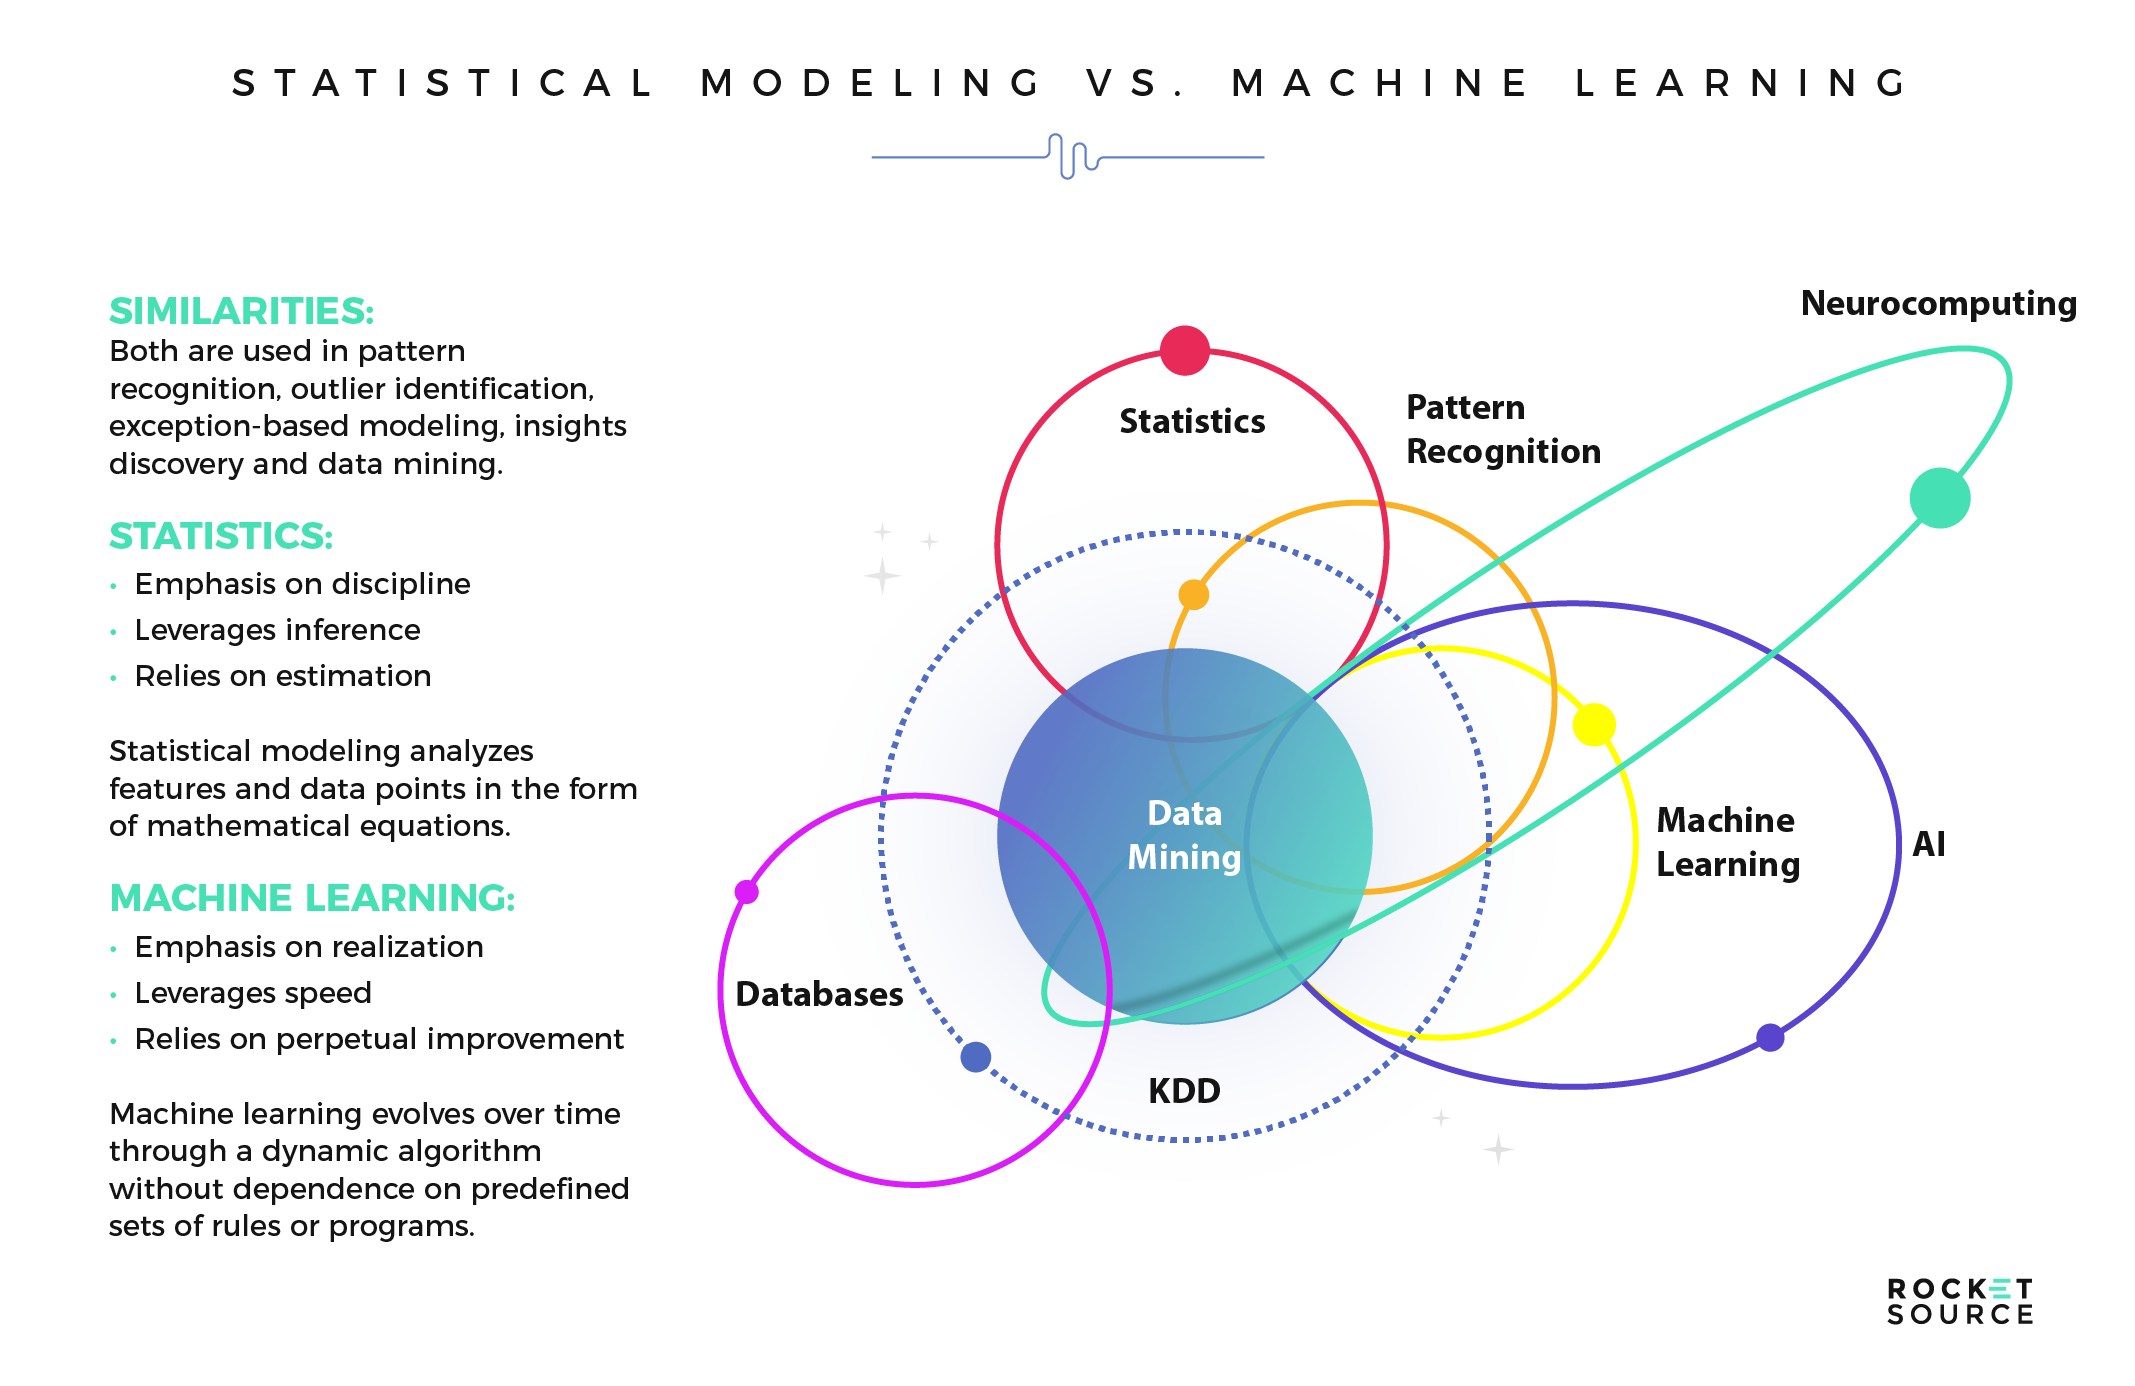
In their simplest forms, both machine learning and statistical analysis serve the same purpose — to gain a deeper informed understanding of a given data set. Both are used in pattern recognition, outlier identification, exception-based modeling, insights discovery and data mining, and are often leveraged to solve the same, or similar, problems. Still, they have their differences.
Statistics emphasizes discipline and leverages inference and estimation. It is the development and translation of interdependence between features and points in the data in the form of mind-bending mathematical equations. Machine learning, on the other hand, emphasizes realization, speed and what we would call perpetual improvement. It is dynamic in that an algorithm evolves along with the data over time, without dependence on a predefined set of rules that are in the form of programs.
The irony (or lack thereof) is that, despite the similarities between machine learning and statistical modeling, each approach has its own independent genealogy. Machine learning is a member of the computer science and artificial intelligence field. This field’s focus is building systems that can learn from data in a dynamic way, instead of relying on rules and absolute programming. On the contrary, statistical modeling is a member of the mathematics field. Over time, as both the volume of data available for modeling and the computational ability to model data have grown, data scientists have been able to build technologies (algorithms) that can learn by analyzing data. Statistical modeling techniques have existed for hundreds of years — before computers were even thought of — while machine learning is relatively new to the scene.
A good example of the differences between machine learning and statistical modeling outcomes when solving the same problem can be seen on the graph below from McKinsey & Company’s article outlining machine learning for executives. With one look, the differences between statistical analysis and machine learning models in reporting on the ever-so-common telecom customer churn example are easy to spot.

A statistical approach in the form of a classic regression analysis presents itself as the simple green line across the center of the chart. The model’s findings, on the other hand, are visualized using gorgeous colors and bubbles to emphasize segregation and parameters for which customers have a higher or lower probability of churning. Machine learning goes well beyond the simple semi-linear boundary, allowing for a deeper and more nuanced delineation of high and low probabilistic areas throughout the data as it pertains to the two features being visualized. We’re willing to bet that telecom industry employees can gather more insight from the machine learning model’s output because it allows them to better identify and predict the customers with the highest risk of churning versus a simple regression line.
Although machine learning models might seem like the best option because of the detail they provide, that might not always be the case. The lines between statistical modeling and machine learning continue to blur around usage and applicability in the business. In deciding which is right for you, it’s important to keep in mind whether you’d benefit more from the straightforward answers of statistical analysis or from the more nuanced insights of machine learning predictions. The reality is, there are complementary uses for both statistical modeling and machine learning and each should be at an organization’s disposal when needed.
Deep Learning vs. Machine Learning Models
One topic we find very interesting and will freely admit consumes much of our free time is machine learning. We devote considerable time to researching meaningful business-level topics related to AI, deep learning and machine learning. Deep learning, in particular, is fascinating, but it is often confused with machine learning. Specifically, confusion arises when considering the potential application of either in terms of understanding the historical and likely future behaviors of humans and the correlation of those behaviors with business outcomes.
If you’re unsure of the core differences between the two, this brief video by MATLAB gives an excellent quick and digestible overview.
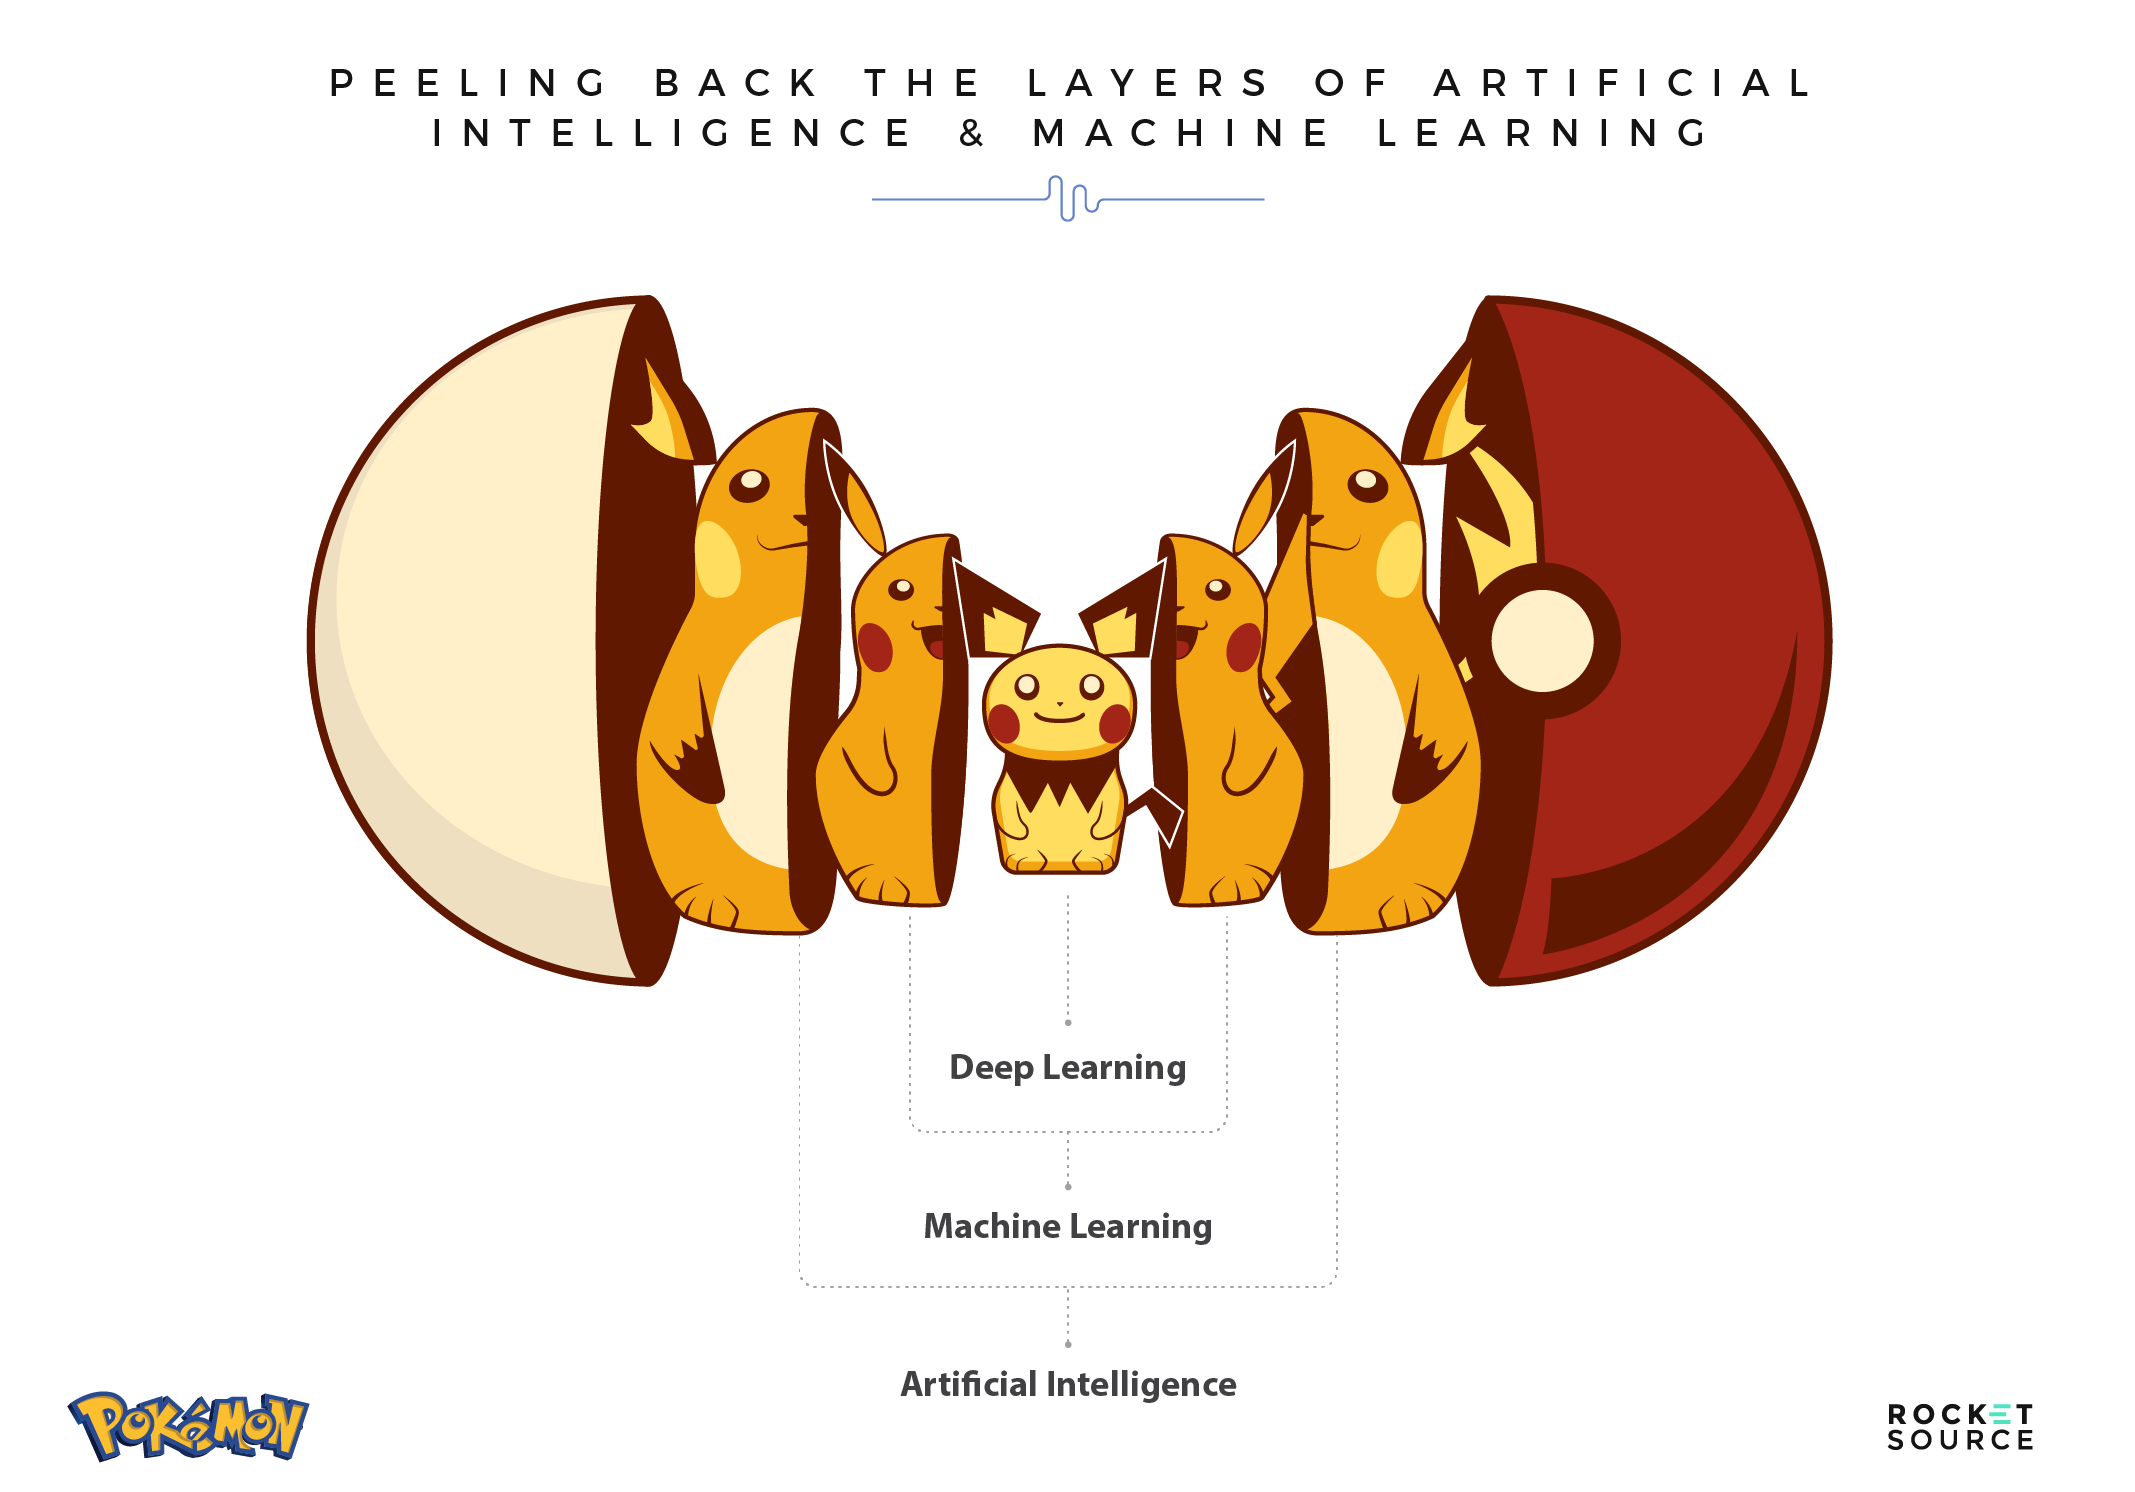
Machine learning requires a person to manually select certain features to learn from. Those features are then used to classify new objects, patterns or behaviors. Deep learning also occurs over time and is based on a feature set, but those features are identified by the model itself rather than being inputted by a person. In its simplest form, deep learning is a subset of machine learning. Machine learning is a subset of AI. Each are important and serve a purpose in the business world.
Artificial Intelligence
AI has been around since the 1950s, and is typically defined as the capability of any modeling approach to imitate human behavior or to solve problems and perform tasks like a human.
Machine Learning
Machine learning originated in the 1980s. While still old by modern terms, it is significantly more progressive than AI. Machine learning is infused with AI techniques allowing computers to learn patterns and behaviors without explicit programming. This is a big deal. Just like the value of a brand new car is in perpetual change as soon as it’s driven off the lot, so is data. Because of this perpetual change, pre-defined rules such as if/then statements can become less effective or increasingly obsolete as time passes if they are not tended to. The dynamic state of machine learning means that it remains in a perpetual state of optimization. In other words, machine learning algorithms are continually working toward an optimal likelihood that predictions are correct as data evolves. This is typically described as a loss or error function. As new and fresher data is added to the model, the optimization is dynamic.
Deep Learning
Deep learning is a subset of machine learning and an even newer and more sophisticated approach, originating in the first decade of the 21st century. Deep learning allows for a comprehensive analytical measure of intelligence for machines rather than solving for a single set of problems. The models rely on features to influence their output, leveraging deep neural networks (layers) of algorithms to solve a problem in every possible way.
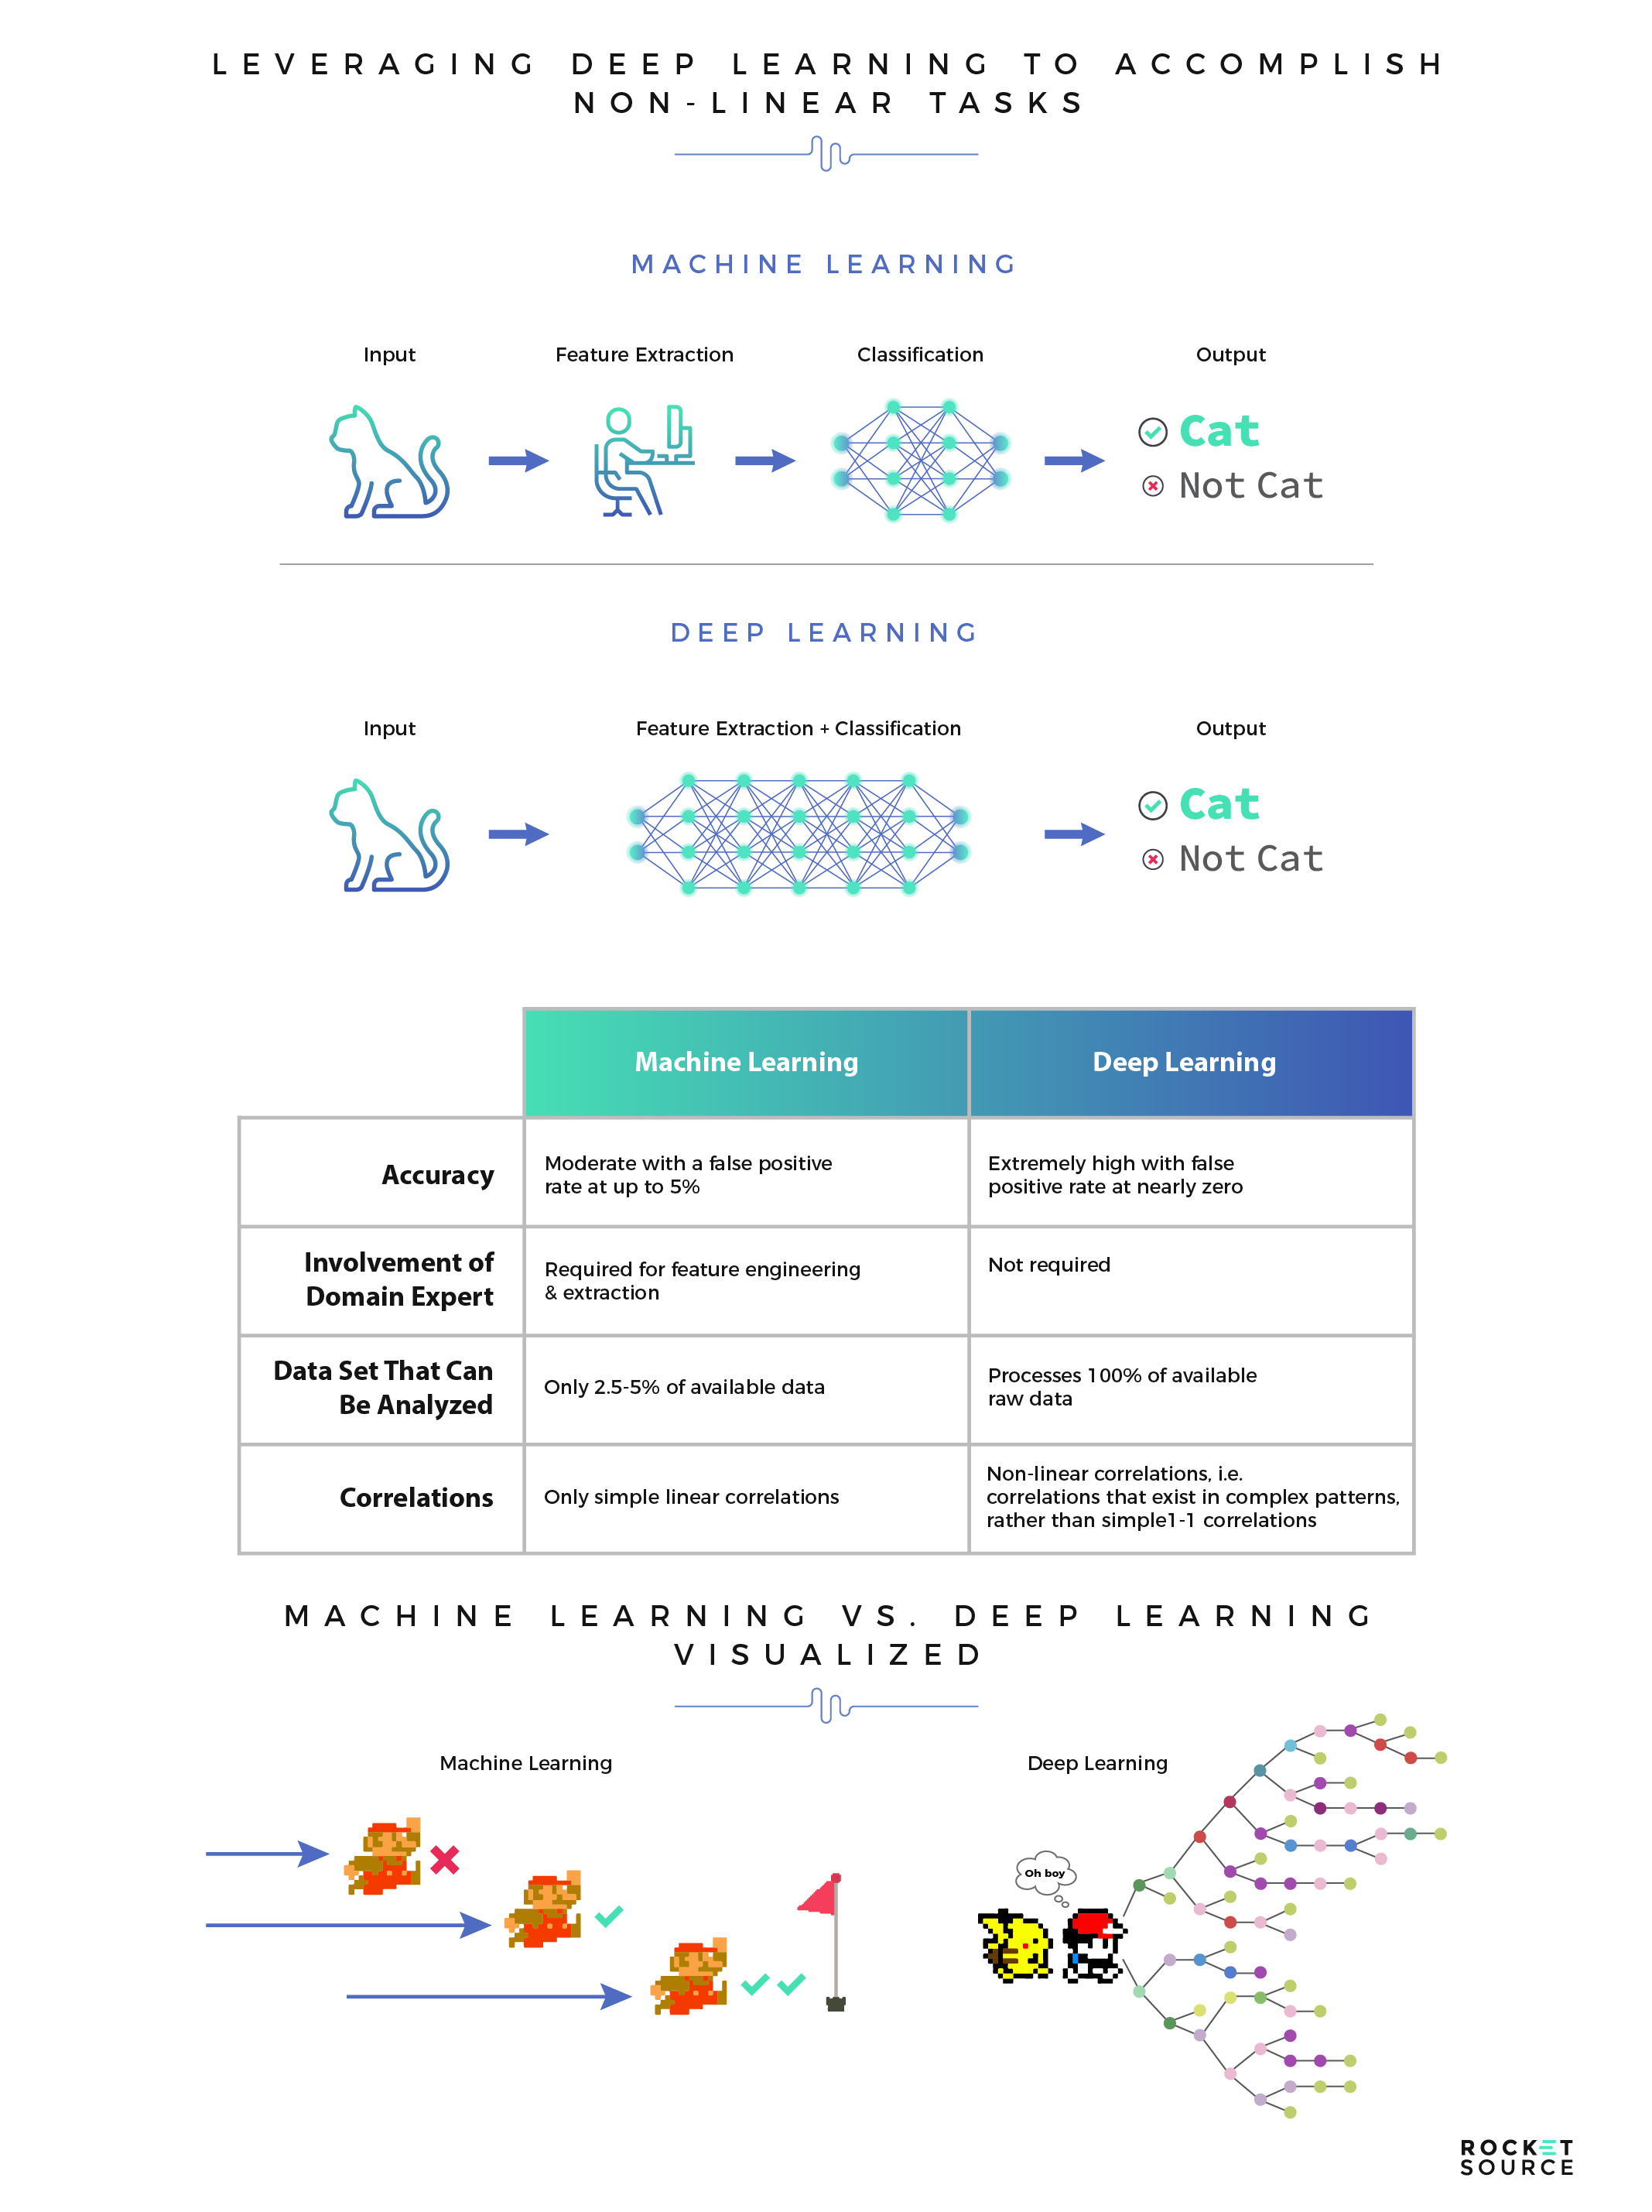
To best illustrate this point we’re turning to an unlikely source — classic video games. Specifically, let’s look at Pokemon and Mario. A machine can beat Mario, but not Pokemon. Why is this? In Mario there is one goal — to make it to the end of the level without dying by moving from left to right and avoiding obstacles. The closer you get to the red flag at the end, the better you’re doing. A machine is typically able to quickly beat computer games like Mario because once it’s learned the details of each conflict, it can pass each level nearly every time.
The game of Pokemon is a little different. For those of you who are unfamiliar, Pokemon doesn’t have a singular end goal. Players don’t move in a linear fashion across the screen but rather are met with a series of options to choose from. What they choose depends on their personal end goal. Some players might choose to go to battle while others choose to move to a new area in the game. The further you progress, the more the options branch out into new scenarios, further increasing the options available. This game requires more of a deep learning model to assess every possible combination of extracted and classified features, drop them into a “black box” form and then deliver an output with the best possible routes for various goals. If this sounds like a daunting task, it is. Feature engineering is labor-intensive, can be complicated and requires a fair amount of time and expertise.
As you can imagine, the level of accuracy of predictions is significantly higher when deep learning approaches are leveraged versus machine learning. Deep learning is often leveraged when non-linear correlations and complex pattern recognition are needed to identify relevant information. In other words, when you’re not moving Mario from left to right on the screen, but are strategizing your next best move in a large open Pokemon map. Let’s be clear though, this doesn’t mean that deep learning is the one-size-fits-all solution. There are many use cases in which machine learning is much more appropriate than deep learning for a number of reasons. For example, machine learning can successfully be used (and is typically used) in moderately large data environments with less accuracy-restrictive problems.
To know what’s right for you, consider the context of your data and the output you hope to achieve. In contrast to machine learning, where there are typically a few thousand data points, specific problems that require deep learning tend to deal with several million data points. Further, the output of a deep learning model can range from a score, number, element, image, audio, text, etc., whereas the output of a machine learning model will typically be a simple number like a classification score (probability) or an integer. Knowing what you have available and what your end goals are is crucial when deciding which approach makes the most sense for your organization. In other words, newer isn’t always better.
Algorithms, Libraries, Toolkits and Platforms… Oh My!
There are a multitude of technologies and frameworks on the market today that enable data scientists and machine learning engineers to build, deploy and maintain machine learning systems, pipelines and workflows. Just like any economic matter, supply and demand drives the improvement and progress of the product. As the use of machine learning in business increases, so does the number of frameworks and software that facilitate full-fledged machine learning workflows.
Because of this influx of new tools, the days of coding up a given algorithm in R and writing API configuration logic from scratch to set up a machine learning workflow are gone. Unless you like to code in R for fun, there’s no longer a reason to do so. That shift isn’t obvious though.
Recently, we were on the phone with a long-time client who inquired about the best way to leverage her skill sets in R and Python to assimilate some basic algorithmic logic into a data virtualization environment. After discussing many different scenarios, it was clear that a set of automated, open-source libraries and toolkits were likely the most ideal setup to achieve an impressive time-to-value. A machine learning environment would have been better because it could scale and ultimately become an automated platform. Even a seasoned engineering and operations team can be unaware of some of the machine learning solutions available to them today which, in large part, are open source.
Modern machine learning solutions allow for minimal latency and impressive accuracy on models due to the automated aspects of many of the libraries and toolkits available.
Unless there’s a definitive reason for tuning and optimizing in order to achieve alpha, you simply don’t have to go through this part of the “old-fashioned” machine learning workflow any longer. There are many options and technologies that will do this in an automated fashion. If your head spins as you look at the options available to you, you’re not alone. There’s a lot out there to choose from. Depending on the focus and maturity of a given machine learning workflow, algorithms with raw code, libraries with broader capabilities, toolkits that offer various levels of automation or full-fledged automated platforms each have their potential place in an organization’s AI stack. To help you understand just how much is available to you, let’s summarize the landscape of options independently and as a whole.
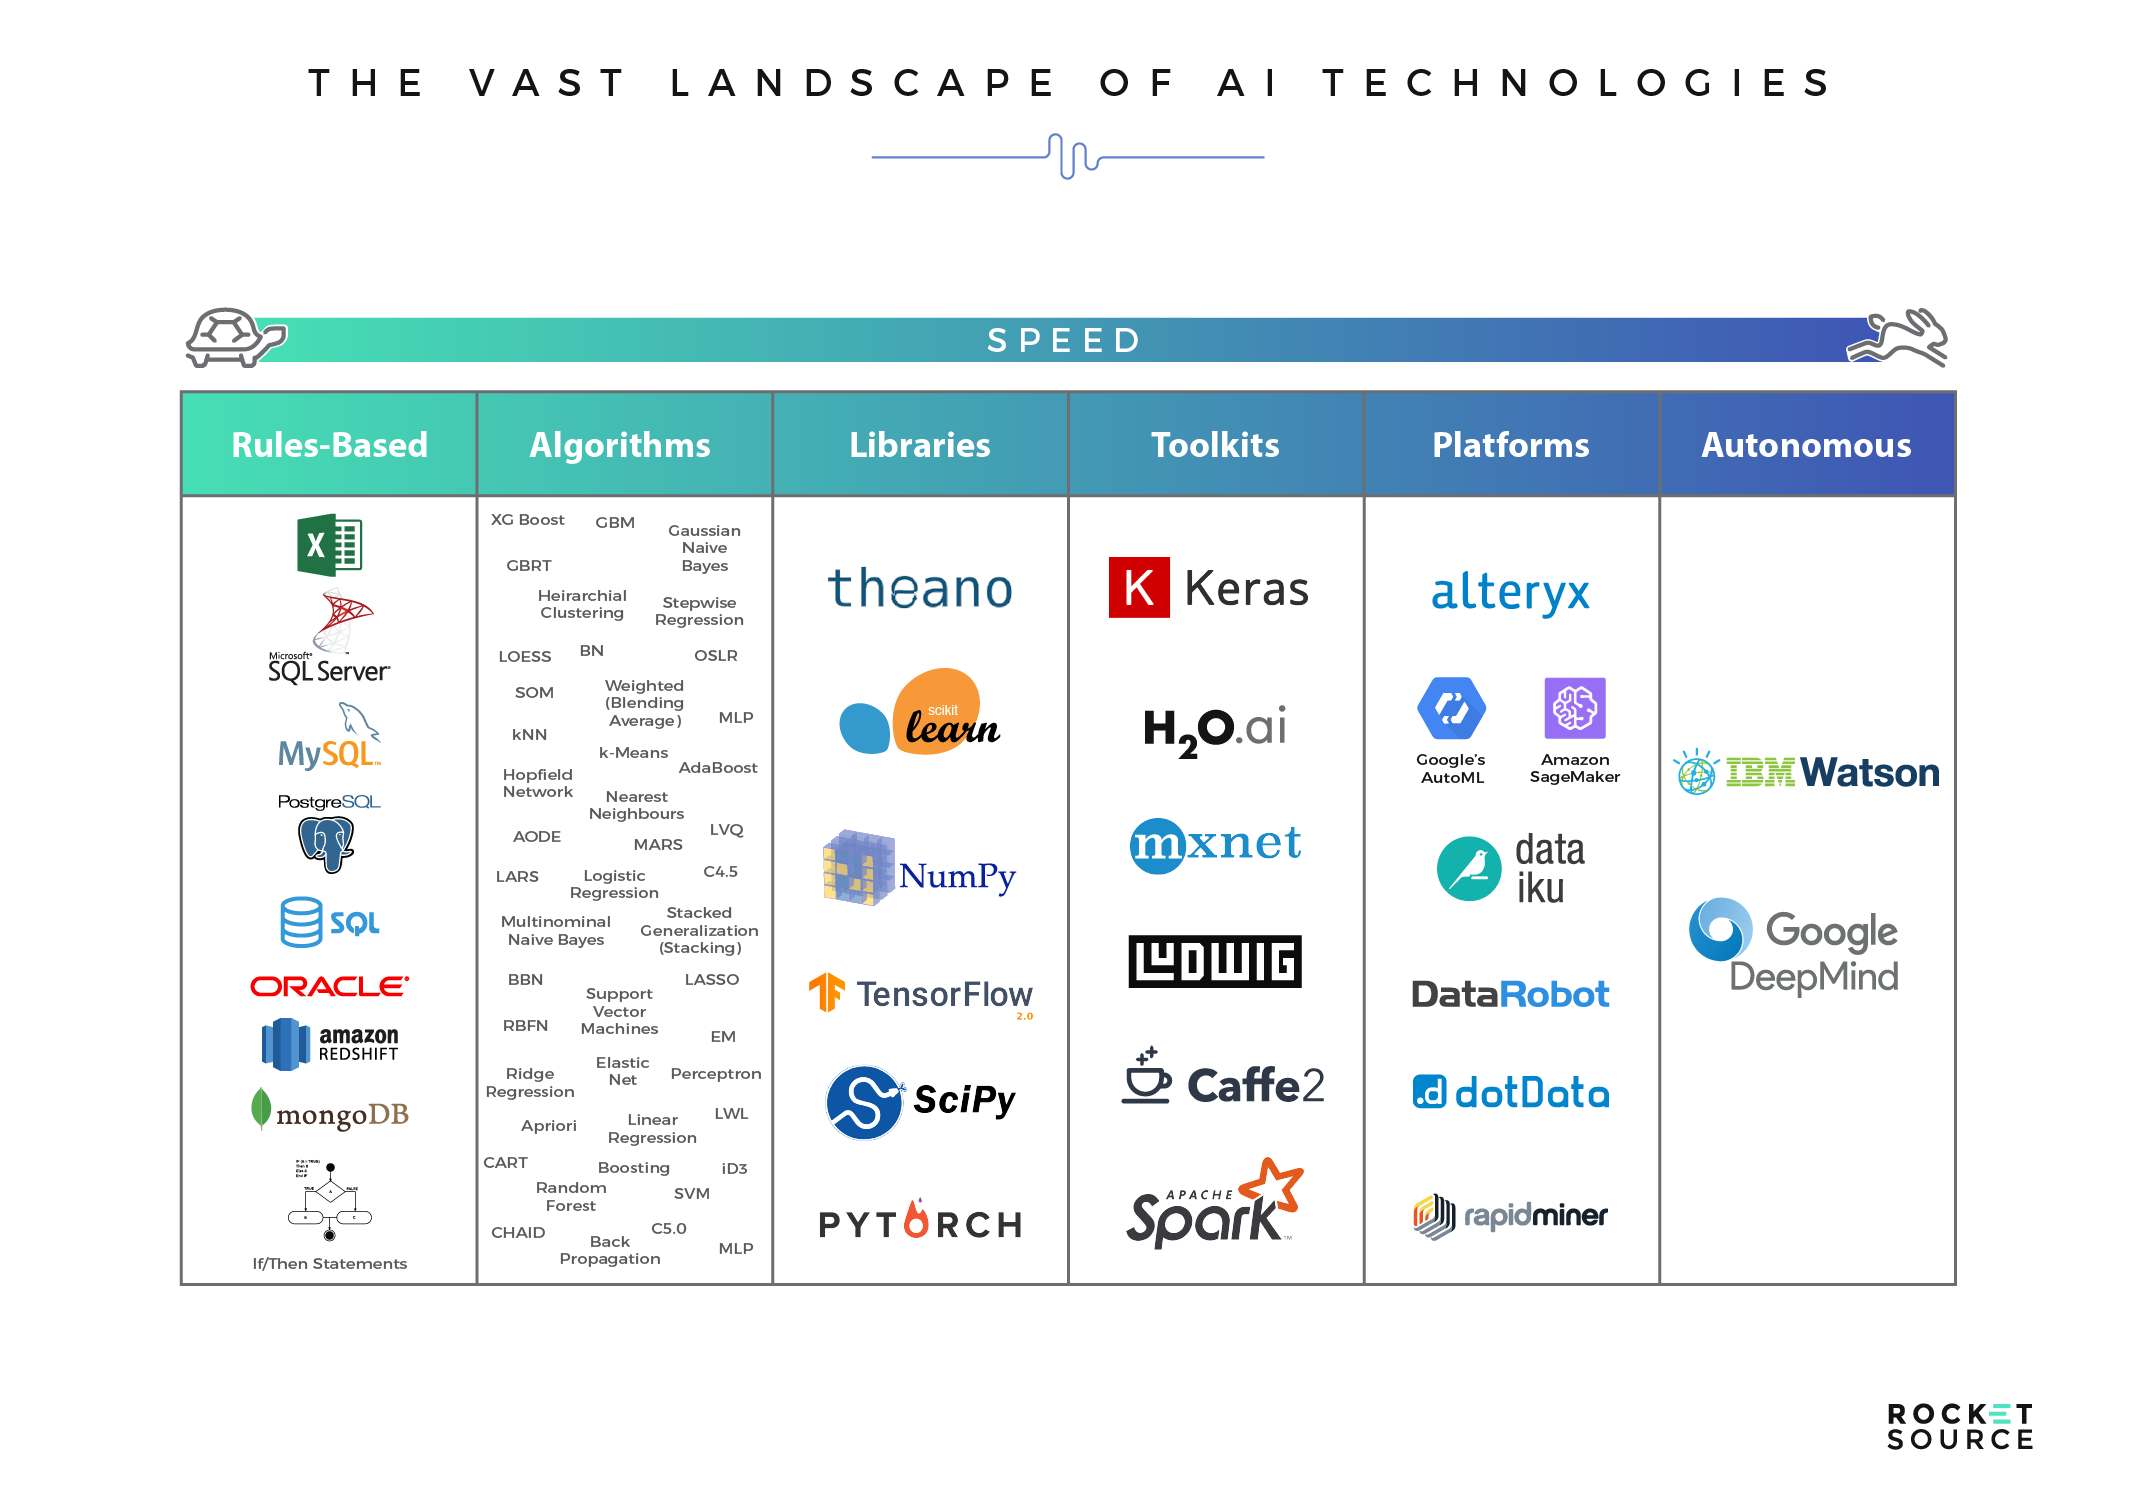
You can see just how many layers there are for you to sift through and choose from. Deciding which option is right for your specific business goals, maturity and infrastructure can be difficult. Let’s break it down.
Algorithms in Manual Workflows
Algorithm selection is a critical component in any primarily manual workflow. The problem is that there’s no one-size-fits-all answer to which algorithm will work best across the board. There are several steps that are optional on a case-by-case basis. Testing several different algorithms in order to identify which one provides the best accuracy for a given set of data is critical. Still, in a manual workflow, relying on people to make the decision about which algorithm to use can be a lengthy process riddled with errors, even when those people are the best data scientists in the industry.
Automated and open-source machine learning cuts through the mess of configuration, getting you into production faster so you can focus on the application to the business rather than on trying to get something meaningful built. Most of the automated products nowadays will perform just as good as, if not better than, a manual model because of their ability to parse and compare multiple algorithms to find the best-performing one specific to the dataset of a given model.
Libraries
Libraries are frameworks of procedures and functions written in a given language. A comprehensive arrangement of libraries allows data scientists and machine learning engineers to execute complex functions without having to originate or rewrite lines of code.
Machine learning codes can be written in many languages, including R and Python. Both of these languages allow for extensive mathematical calculations, optimization, statistics and probabilities. However, one of Python’s powerful capabilities is its extensive set of libraries. Most of the commonplace libraries possess an API that Python can leverage in order to create automated integrations to critical systems and applications, making the language a great means for developing integrated workflows. Let’s look at two of Python’s more popular libraries.
Scikit-learn
![]() Scikit-learn (SKL) is a commonplace library used by developers and organizations across the world. It features most of the classical supervised and unsupervised learning algorithms including linear regression, logistic regression, Gradient Boosting, Naive Bayes, PCA, K-Means and Support Vector Machines, to name a few.
Scikit-learn (SKL) is a commonplace library used by developers and organizations across the world. It features most of the classical supervised and unsupervised learning algorithms including linear regression, logistic regression, Gradient Boosting, Naive Bayes, PCA, K-Means and Support Vector Machines, to name a few.
One critical component, which is sometimes overlooked, is its diverse capability in data preprocessing and results analysis, explainability and reporting. Because traditional machine learning algorithms are SKL’s heritage and niche, this library stays maniacally targeted on these components. Although helpful, some data scientists assert this as a weakness because of the limited capabilities for interfacing with neural networks and deep learning-worthy initiatives.
TensorFlow
 TensorFlow (TF) is a machine learning- and deep learning-capable library built by Google. It leverages a multitude of traditional machine learning algorithms for both classification (binary and multi) and regression analysis.
Because of its expansive deep learning capabilities, the library is a bulky framework compared to SKL. To this end, the two libraries are often configured into workflows together in a cohesive set of systems and logic, which often starts in SKL and matures in an incremental fashion into TF.
In addition to SKL and TF, there are many libraries available to data scientists and machine learning engineers. But, it won’t matter which library you use if you don’t first understand the problems you are attempting to solve, the tangential factors, and various levels of maturity that exists across the organization. Only once you have that understanding can you select the library, or set of libraries, that will allow for an optimal and consumable workflow.
Toolkits
Toolkits are often built on a set of algorithms and libraries with various levels of “non-code” interfaces that allow the non-data scientist to leverage these powerful capabilities without having to draw up hardcore code. There are a few critical points specific to these toolkits.
- Automation: Most machine learning workflows require a heavy amount of cleaning, integrity accommodation, feature engineering, fitting, parameterization, etc. that most of these toolkits automate. This automation ensures that a non-technical analyst who may not understand best practices of proper imputation, encoding, cleansing, binning and feature engineering likely could still leverage an open-source toolkit to execute a machine learning and deep learning model into production.
- Dynamic Algorithm Integration: Many seasoned developers integrate toolkits in their workflows today for the ability to dynamically leverage the best-fitting algorithm for a given dataset. The ability to bypass some of the more labor-intensive preparation and preprocessing makes sense for those looking to achieve democratization of their models and competitive time-to-value.
So, what does this look like in the real world? Take Uber’s Ludwig toolbox as an example.
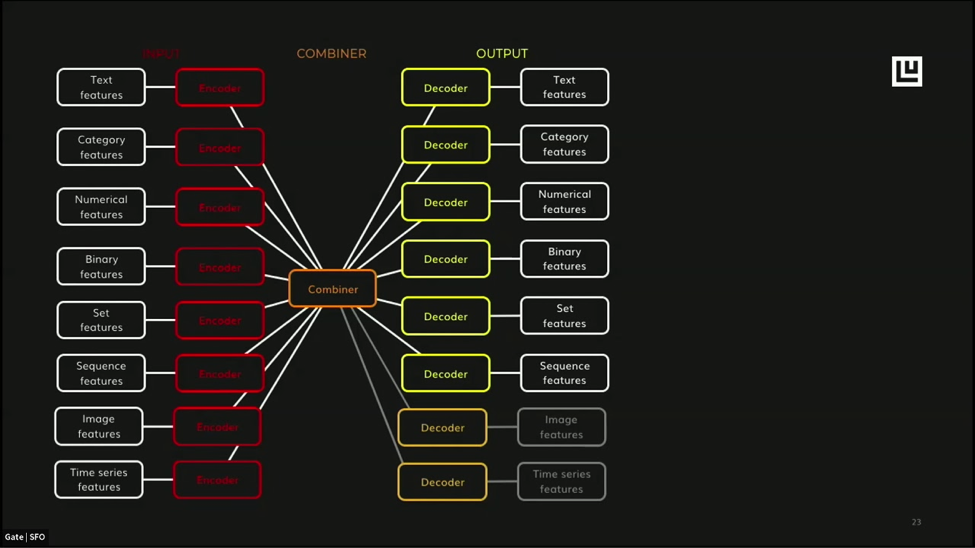
Ludwig is built on top of TensorFlow, which means it has automated deep learning capabilities of features and classifiers so that models don’t have to be coded manually. Although automated, the model configuration is still done in various protocols, including a combination of command line and Python code. Therefore, we mere mortals (yes, that’s directed at you Piero Molino) still might assert that some code is required.
The Ludwig toolkit dropped in 2019 and we can vouch for its capabilities. In fact, we use it here at RocketSource on a regular basis for the reasons listed above. Ludwig is a prime example of an extensible, out-of-the-box toolkit. Whether you’re building a deployable machine learning or deep learning model, having automated accommodations around imputation, encoding, integrity and more in a competitive period of time with accuracy is critical when developing a workflow that can be configured and repeated over and over again in an organization.
Platforms
Organizations in which executives champion machine learning and teams have widely adopted it typically invest in machine learning platforms. These platforms enable a broader user base and leverage the provider’s expertise in scoping, configuration, deployment, adoption and maintenance of a given model or set of models.
There are many comparable platforms on the market today. At their foundations, most platforms possess the ability to scope, configure, deploy, adopt and maintain, while many include additional integration, interface and inference capabilities. These granular capabilities are important to consider as you decide which platform is right for you. To help our clients at RocketSource, we leverage various protocols in running a Cost-Benefit Analysis similar to the one you see here:
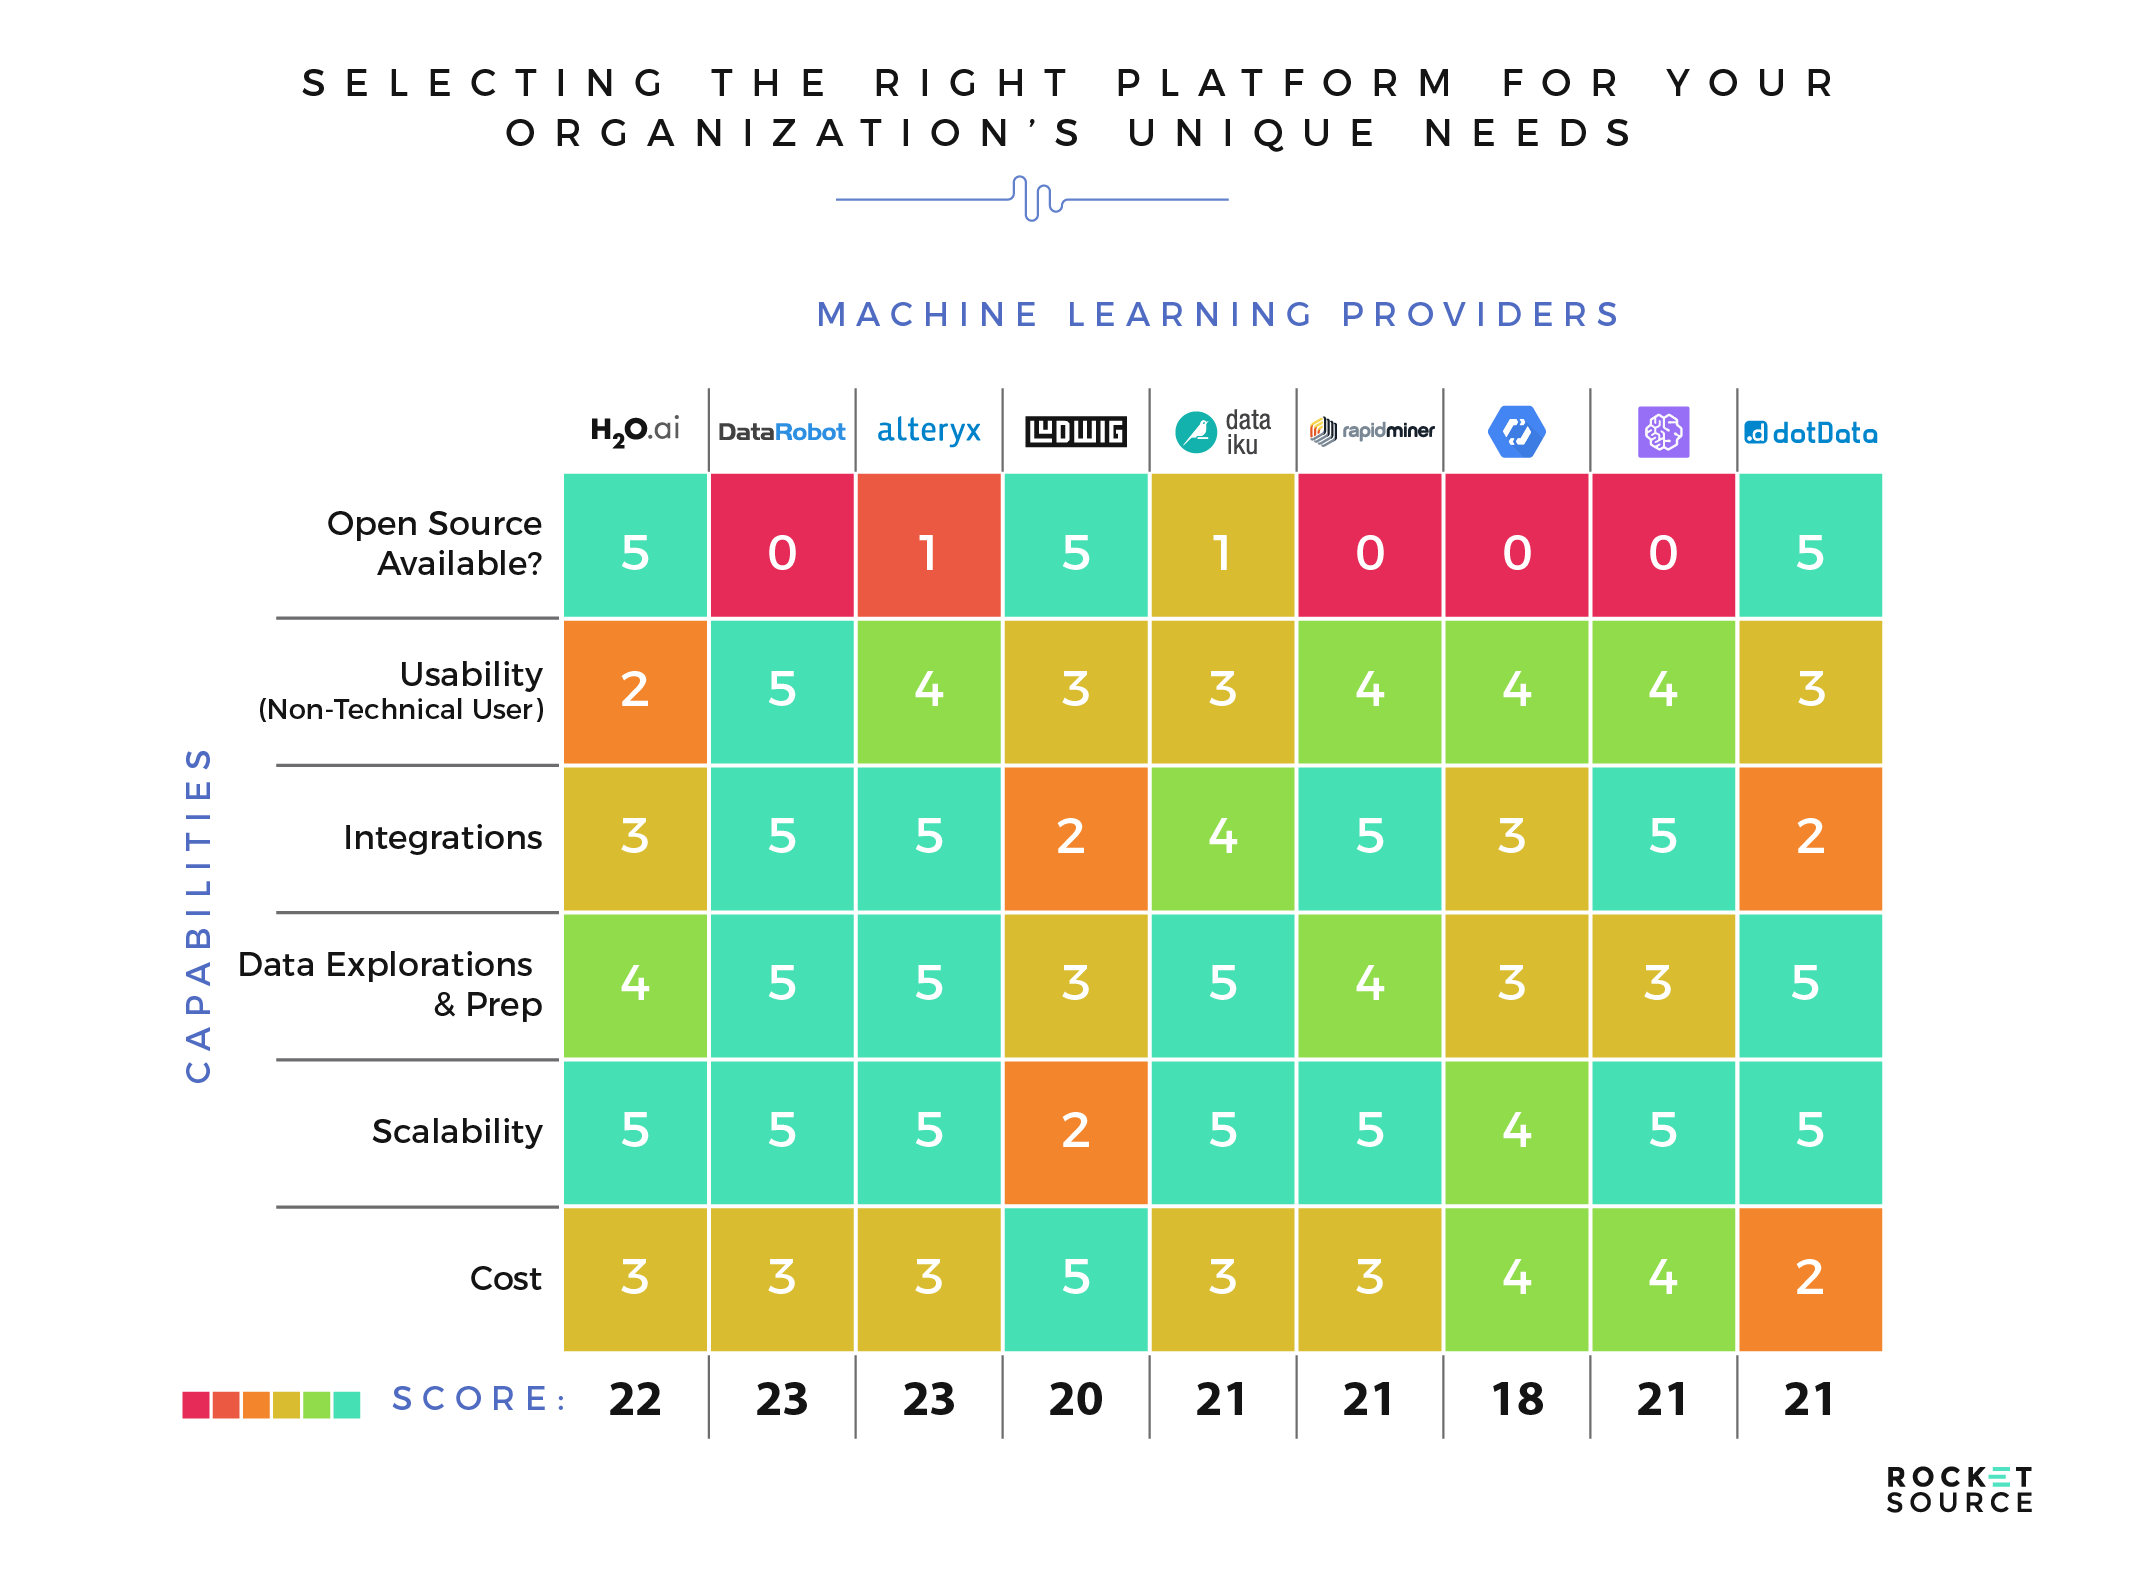
In a Cost-Benefit Analysis, we outline a set of critical parameters and requirements as they relate to the business through a set of scoping and strategic efforts. The goal is to surface the most appropriate technologies for the business based on its current state and short-to-long-term goals. One of the best-known and widely adopted platforms with these capabilities is Alteryx. Although we’re strictly “platform agnostic” here at RocketSource, we’ll focus on Alteryx for the sole purpose of adequately articulating the typical functionalities we solicit to build out a Cost-Benefit Analysis around the many automated machine learning platforms available today.
Alteryx
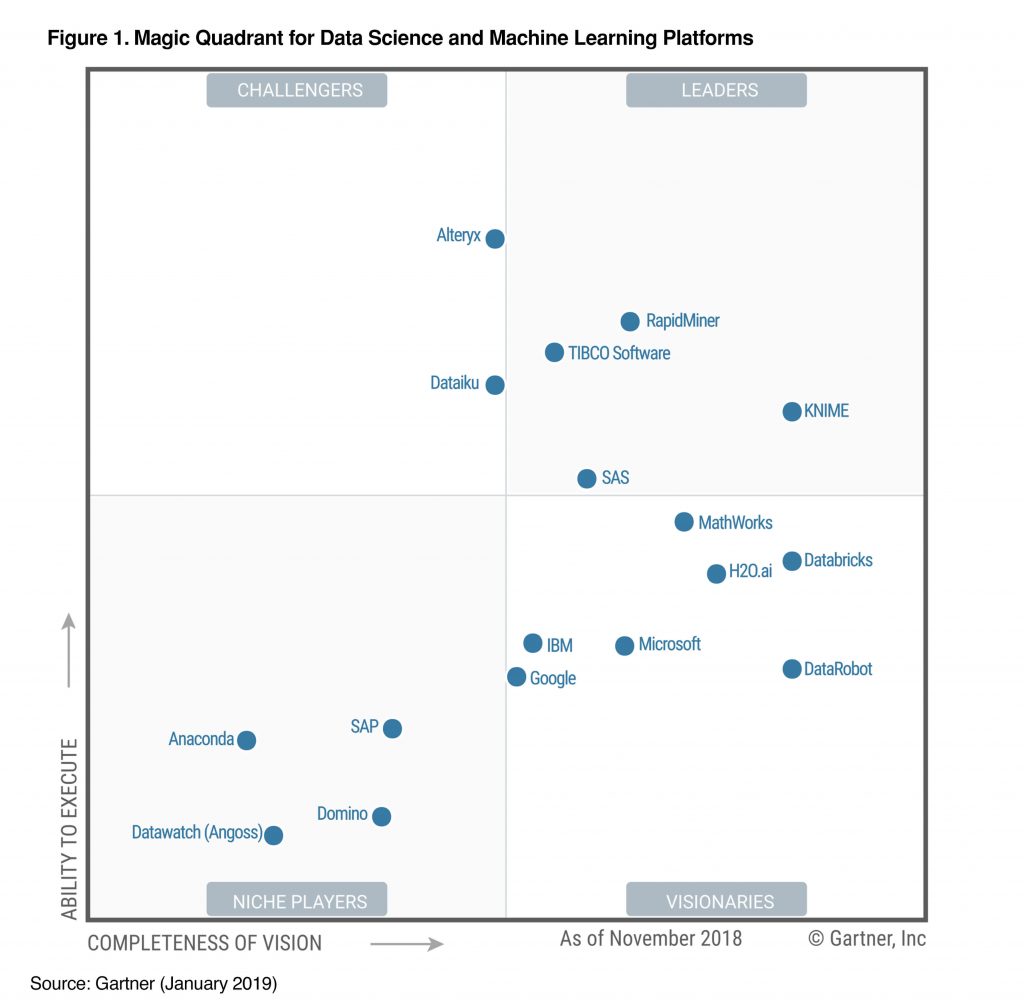
Alteryx continues to be a relevant competitor in the machine learning industry. In fact, in Gartner’s Magic Quadrant for Data Science and Machine Learning, Alteryx is one of only two ‘Challengers’ to the industry leaders.
Alteryx hangs their hat on their ability to make data science available to citizen data scientists and the end-to-end users they’re servicing on a daily basis. Like most of the platforms available today, Alteryx boasts a graphical user interface (GUI) that allows for usage and consumption by the broader layman. It looks something like this:
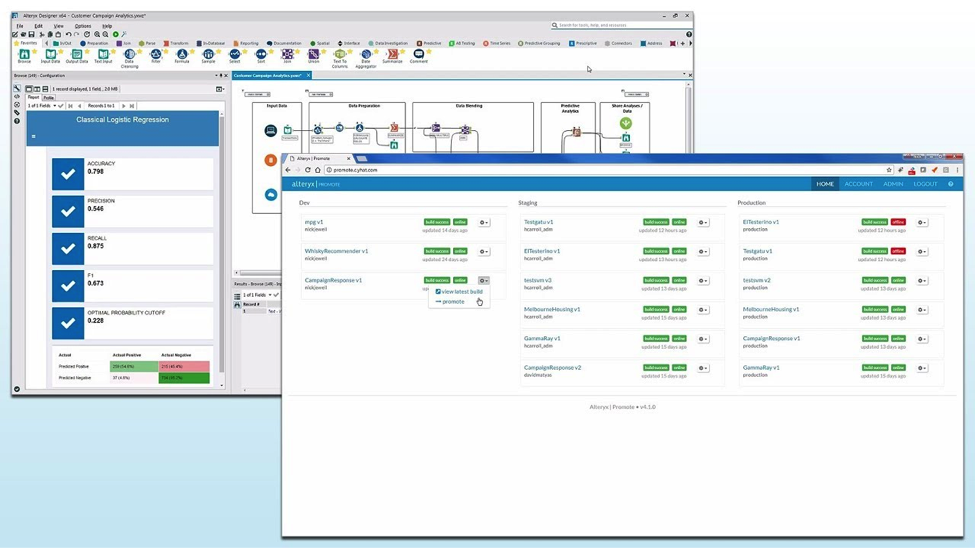
Although the GUI is easy to digest, the workflow includes rich in-product capabilities including data integrations/querying, manipulation and preparation as well as feature selection and model execution. These capabilities are performed on a canvas that allows for commenting and markups for the articulation of critical workflow and configuration information. Further, the underlying code of a given model configuration is made available to be leveraged and executed in various languages including cURL, R, Python, Ruby, Java, PHP and even SalesForce. Model types and supporting algorithms for numerical predictions include Linear Regression, Spline, Gradient Boosting and Gamma. For classification models, Boosting, Logistic Regression (Binary), Decision Trees, Random Forest and Naïve Bayes algorithms are available. Once models have been inferred or surfaced based on fit of the aforementioned algorithms, predictions are rendered into the database or primary data repository of choice and outputs are disseminated accordingly.
Like many platforms, Alteryx integrates seamlessly with most of the major data repositories and technologies. We counted 89 total integrations on their website. These integrations allow for a level of scaling and reach that is quite impressive. While this all might sound technical in nature to a non-data scientist, the way the platform disseminates knowledge using these capabilities makes data digestible across the organization.
As mentioned before, Alteryx isn’t alone in offering capabilities like these. Although they’re an excellent competitor in the industry, other platforms may be better suited for an organization depending on its unique needs. The key to choosing the best platform for your organization is to identify which problems you’re trying to solve using machine learning models.
The Approach to Building Machine Learning Models
Hopefully by now, you’re starting to get the big picture of advanced analytics and the basic items needed to power an intelligent model — not just any model, but one that can be predictive in nature and can be a defining competitive differentiator.
Before you can develop an advanced analytics strategic roadmap — something we at RocketSource are well-known for building and operationalizing — you first need to identify the business opportunities that are most conducive to modeling. As you’ve seen, modeling can be approached in a multitude of ways, from rules-based with SQL to deep neural networking. Although it’s valuable to understand the different types of learning available so you can marry the problem you’re trying to solve with the most effective approach, it can also be detrimental. Trying to dig into each of the machine learning models to the nth degree can send you down the wrong path. Instead, starting with a clear business objective will help you create a model that’s appropriate, accurate and decipherable.
Leveraging the Right Learning Structure
In an ideal scenario, the outcomes of machine learning models are highly relevant and applicable, and resonate across the organization. In a not-so-ideal scenario, there’s a hazy gray area concerning the delineation of characteristics from one class to the next, which can limit the actionability and final value of the model. Knowing the difference, as well as knowing your objectives, will help you determine whether the model is worth leveraging, or if the results would get caught in that gray area, making the model less actionable and valuable.
It’s important to address something here. That possible gray area and lack of valuable deliverables have the potential to dampen the hype around machine learning models. Our goal isn’t to put out the flame on such a hot topic. Instead, we aim to educate while setting the proper expectations around each model.
Ultimately, if your models are not applicable, actionable and relevant, those efforts will surely affect your team’s morale and your organization’s incremental Internal Rate of Return (IRR).
Before you can dig into a specific problem, it’s useful to understand what the process could look like, how to approach your learning, and what the possible outcome opportunities are. The first step in this process is to understand the various learning structures available to you — supervised, unsupervised and semi-supervised.
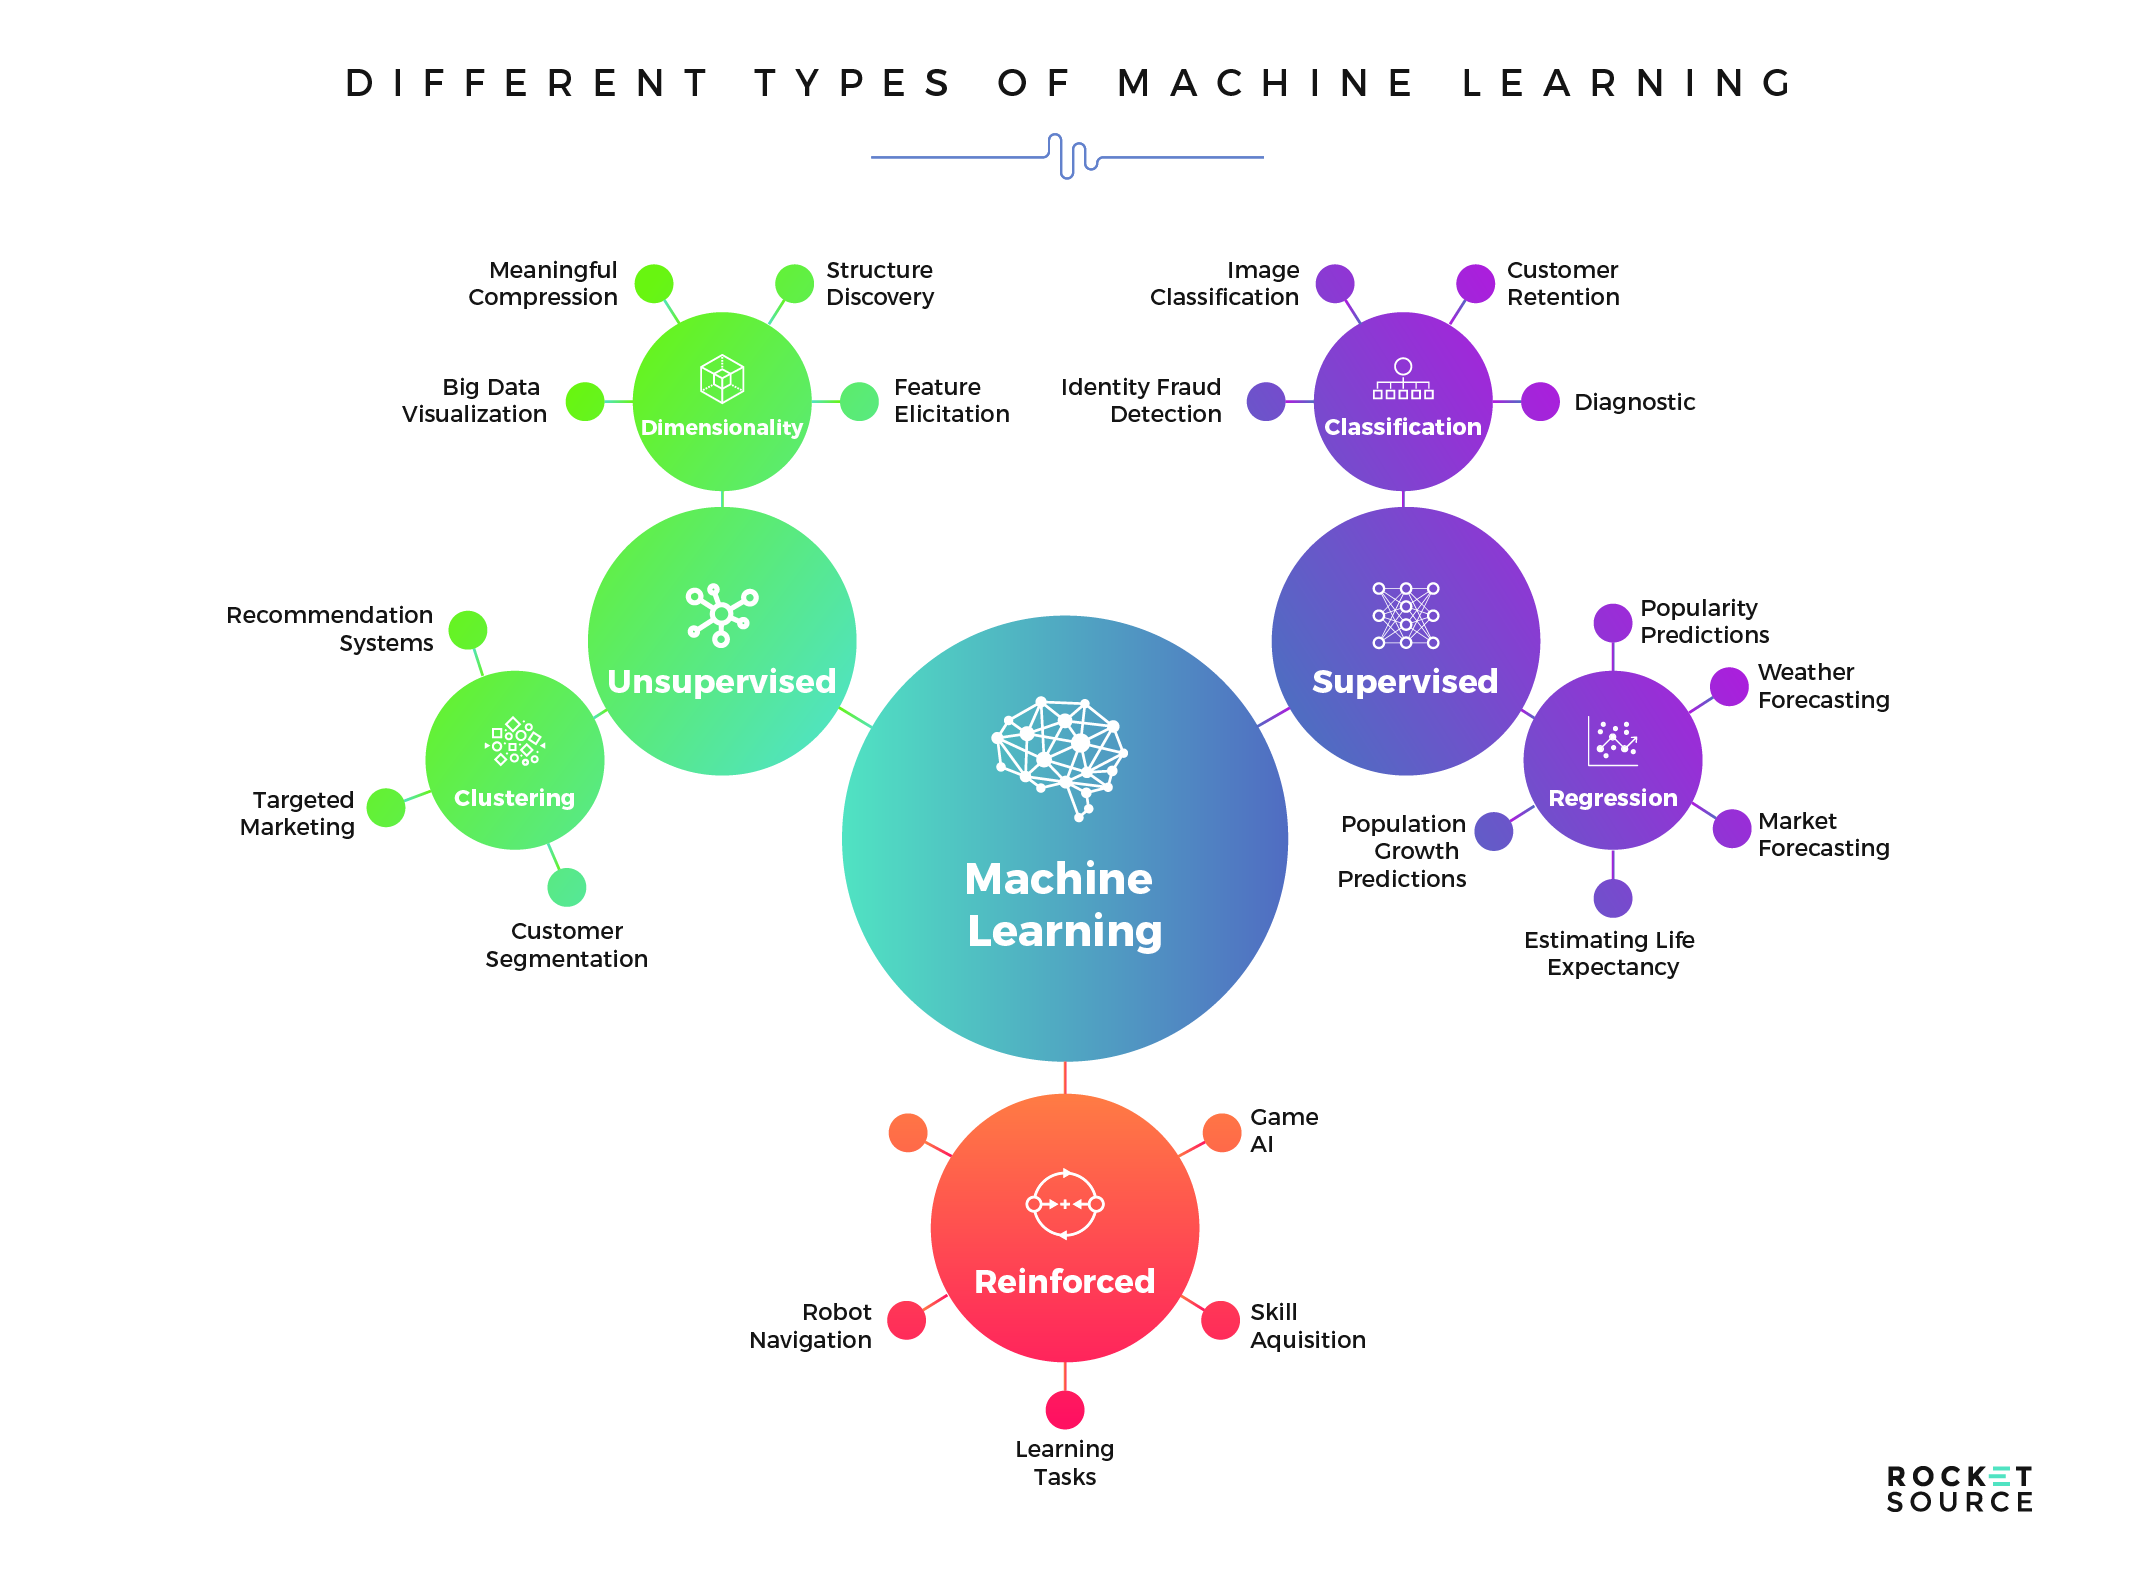
For a high-level understanding of the difference between these learning structures, think of machine learning as a student and the learning structure type as a school. Within the school, there are classrooms where teachers are present and actively training students using predetermined guidelines, as in supervised models. Unsupervised models are more like the playground. These models are let loose to run free and make up their own set of rules. Reinforced, or semi-supervised models are like the gymnasium where there are certain rules in place, but models are given freedom to explore and come up with new ideas. Let’s take a closer look at each learning structure to help you understand which model makes the most sense for you.
Supervised
Supervised learning takes an input variable (x) and maps it to an output variable (y), empowering you to make predictions for a particular data set. We call this supervised because it mimics the process of a teacher supervising students throughout the learning process. Once the algorithm is performing sufficiently, it stops learning.
To illustrate how this works, let’s look at lead targeting, which looks for a simple yes or no answer regarding whether a lead is likely to convert. This answer would give us an actionable next step — to target the lead or not. To run this model, we would leverage a similar dataset with one record for every lead in our data and a classification algorithm (Logistic Regression, Gradient Boosting Trees, Random Forest, K-Nearest Neighbors, Support Vector Machines, etc.) that would attach a probability score to each lead.
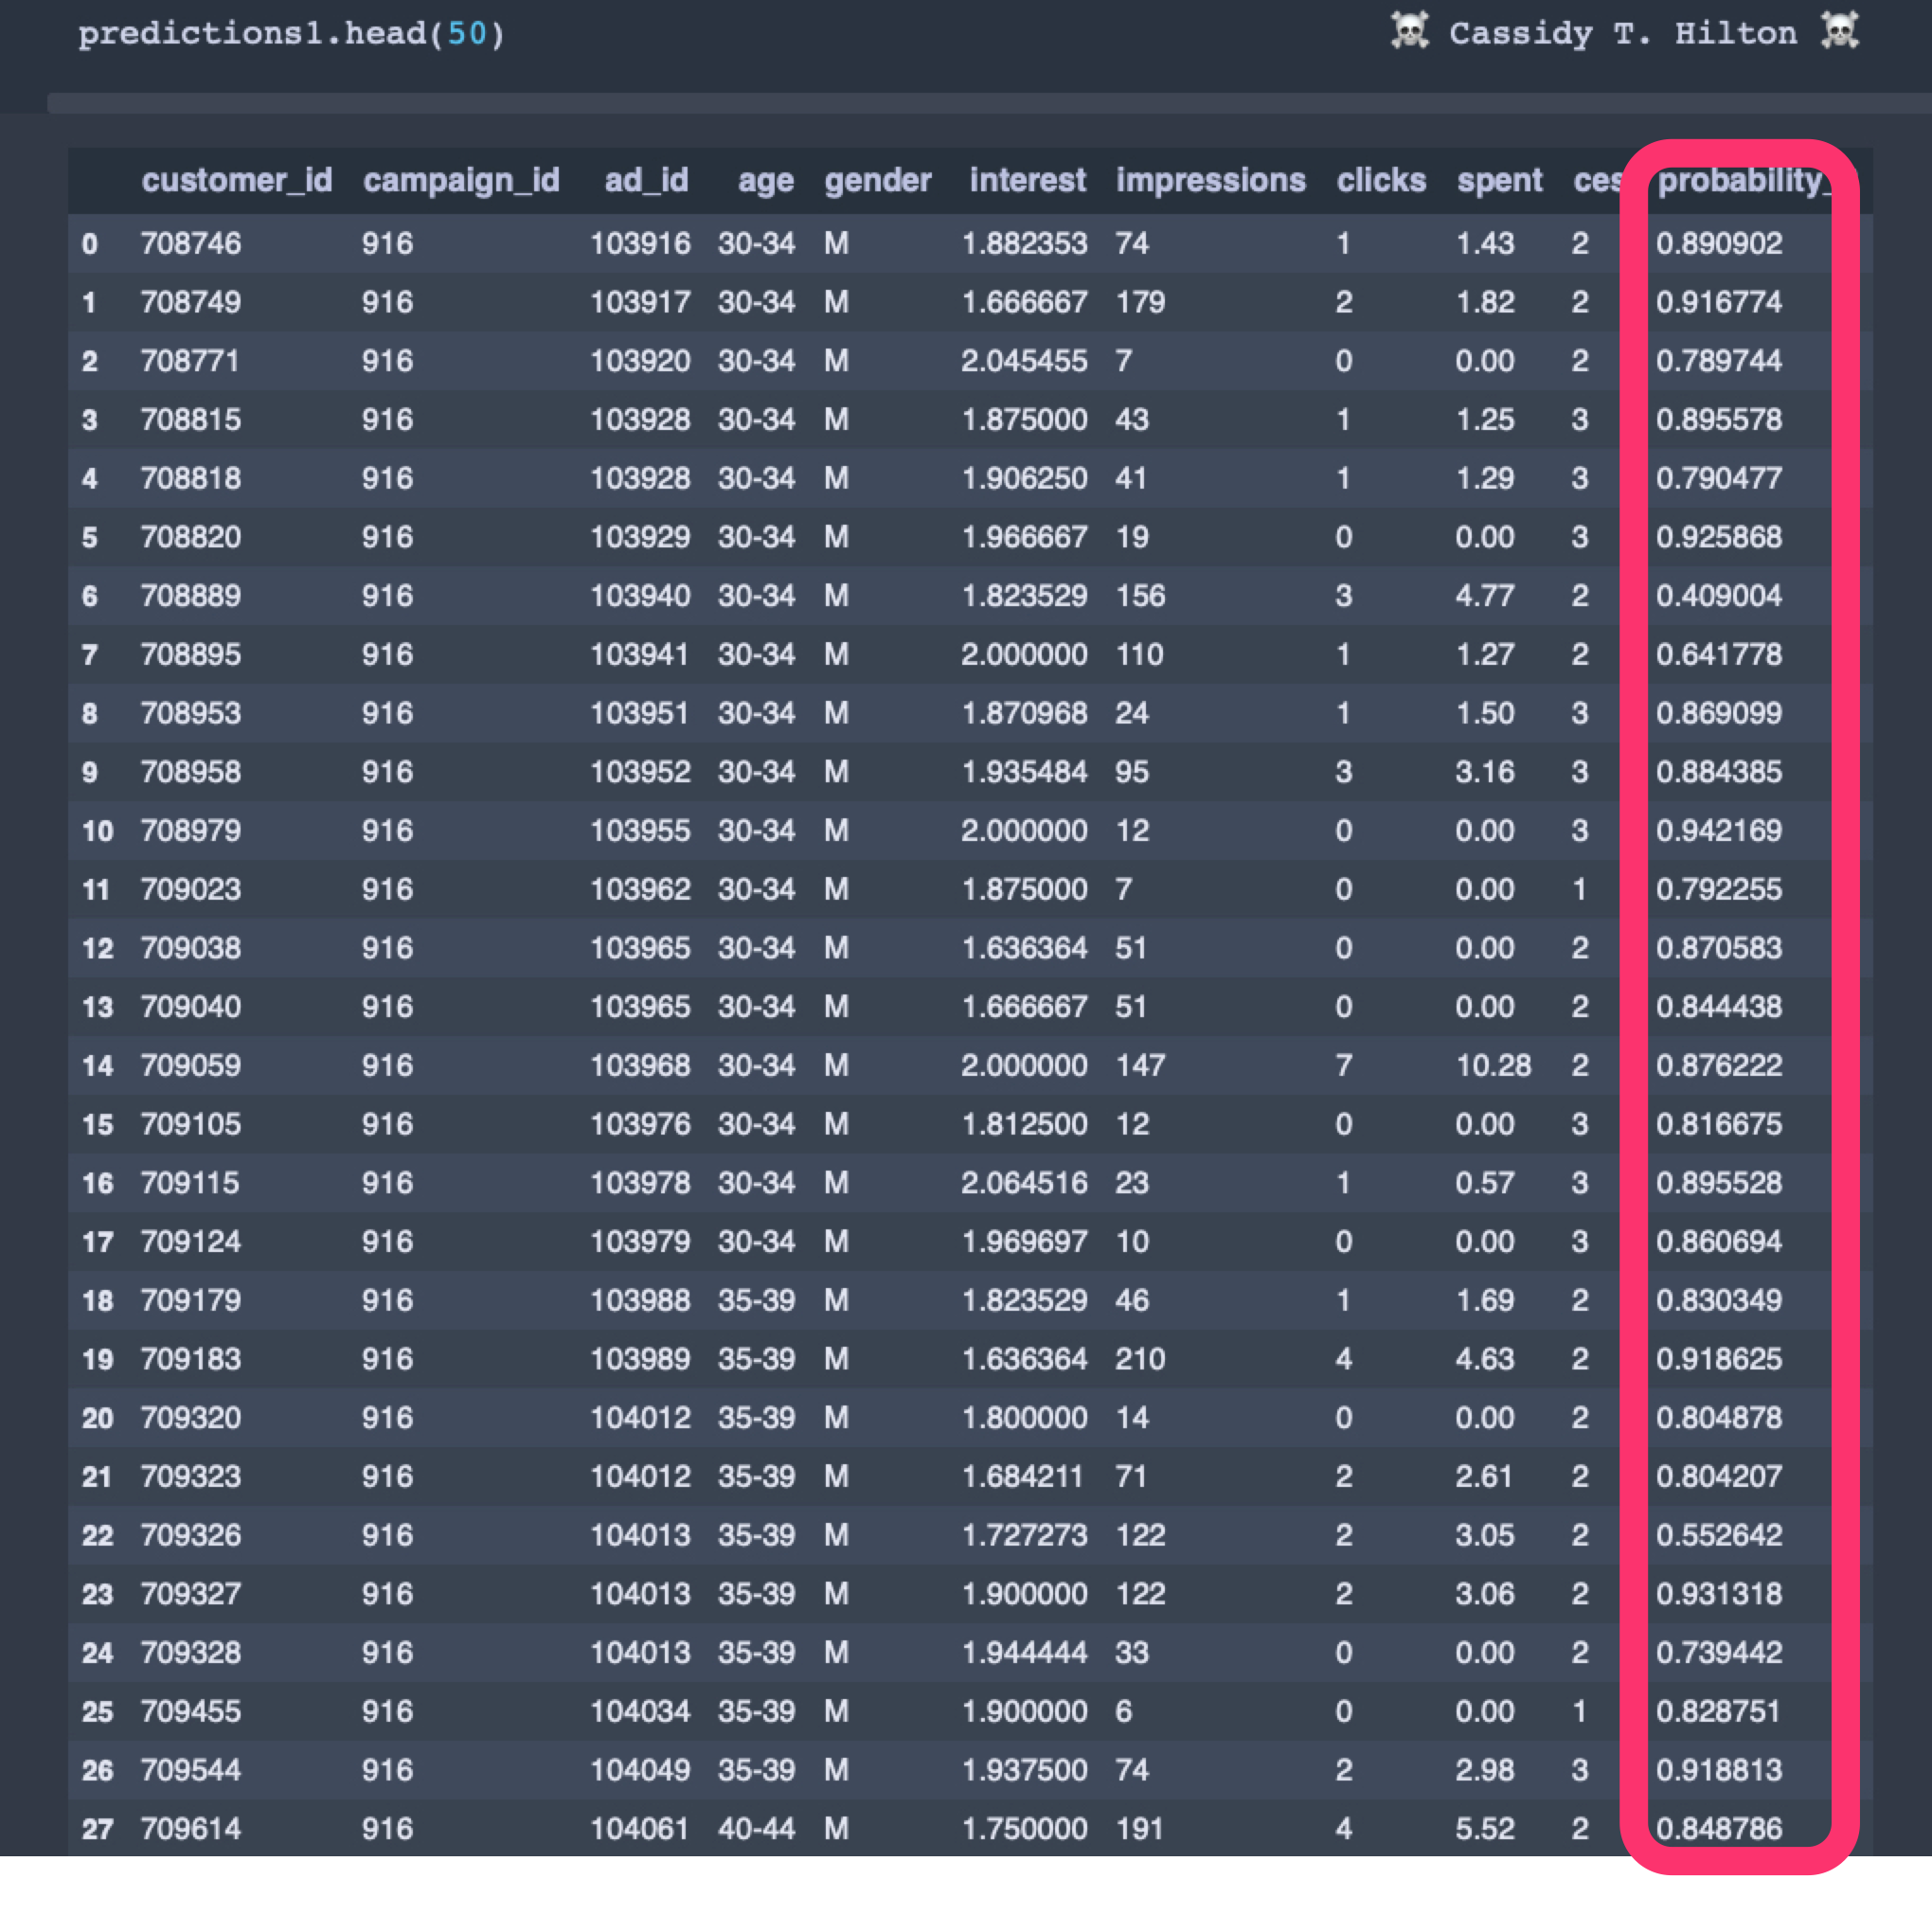
That probability score could be leveraged to infer the most worthwhile leads to target. It also allows for cross-analysis of the most valuable areas for the business to target, such as geographic, demographic, specific campaigns, experiential scoring cohorts, etc.
Unsupervised
Unsupervised learning involves input data (x) only. The goal of unsupervised learning isn’t to get an answer from the dataset but rather to learn more about the data you already have. Two types of algorithms are used to analyze and group data — clustering and association. Here’s a quick description of each:
- Clustering algorithms identify clusters, or groups, of cohorts with similar purchase behaviors.
- Association algorithms identify common attributes among the data, helping to predict future behavior patterns through past indicators. For example, people who buy X are more likely to buy Y.
Neither of these cases rely on a specific output to come up with a yes or no answer. Instead, algorithms in an unsupervised learning environment look for patterns within the data to draw conclusions.
To illustrate this point, let’s continue with the lead targeting example. In an unsupervised learning scenario, we could apply a clustering algorithm to a list of leads with appropriate attributes or features to cluster each lead into N classes. The result would be that each record (lead) in the dataset would have an appended class number. It looks something like this:
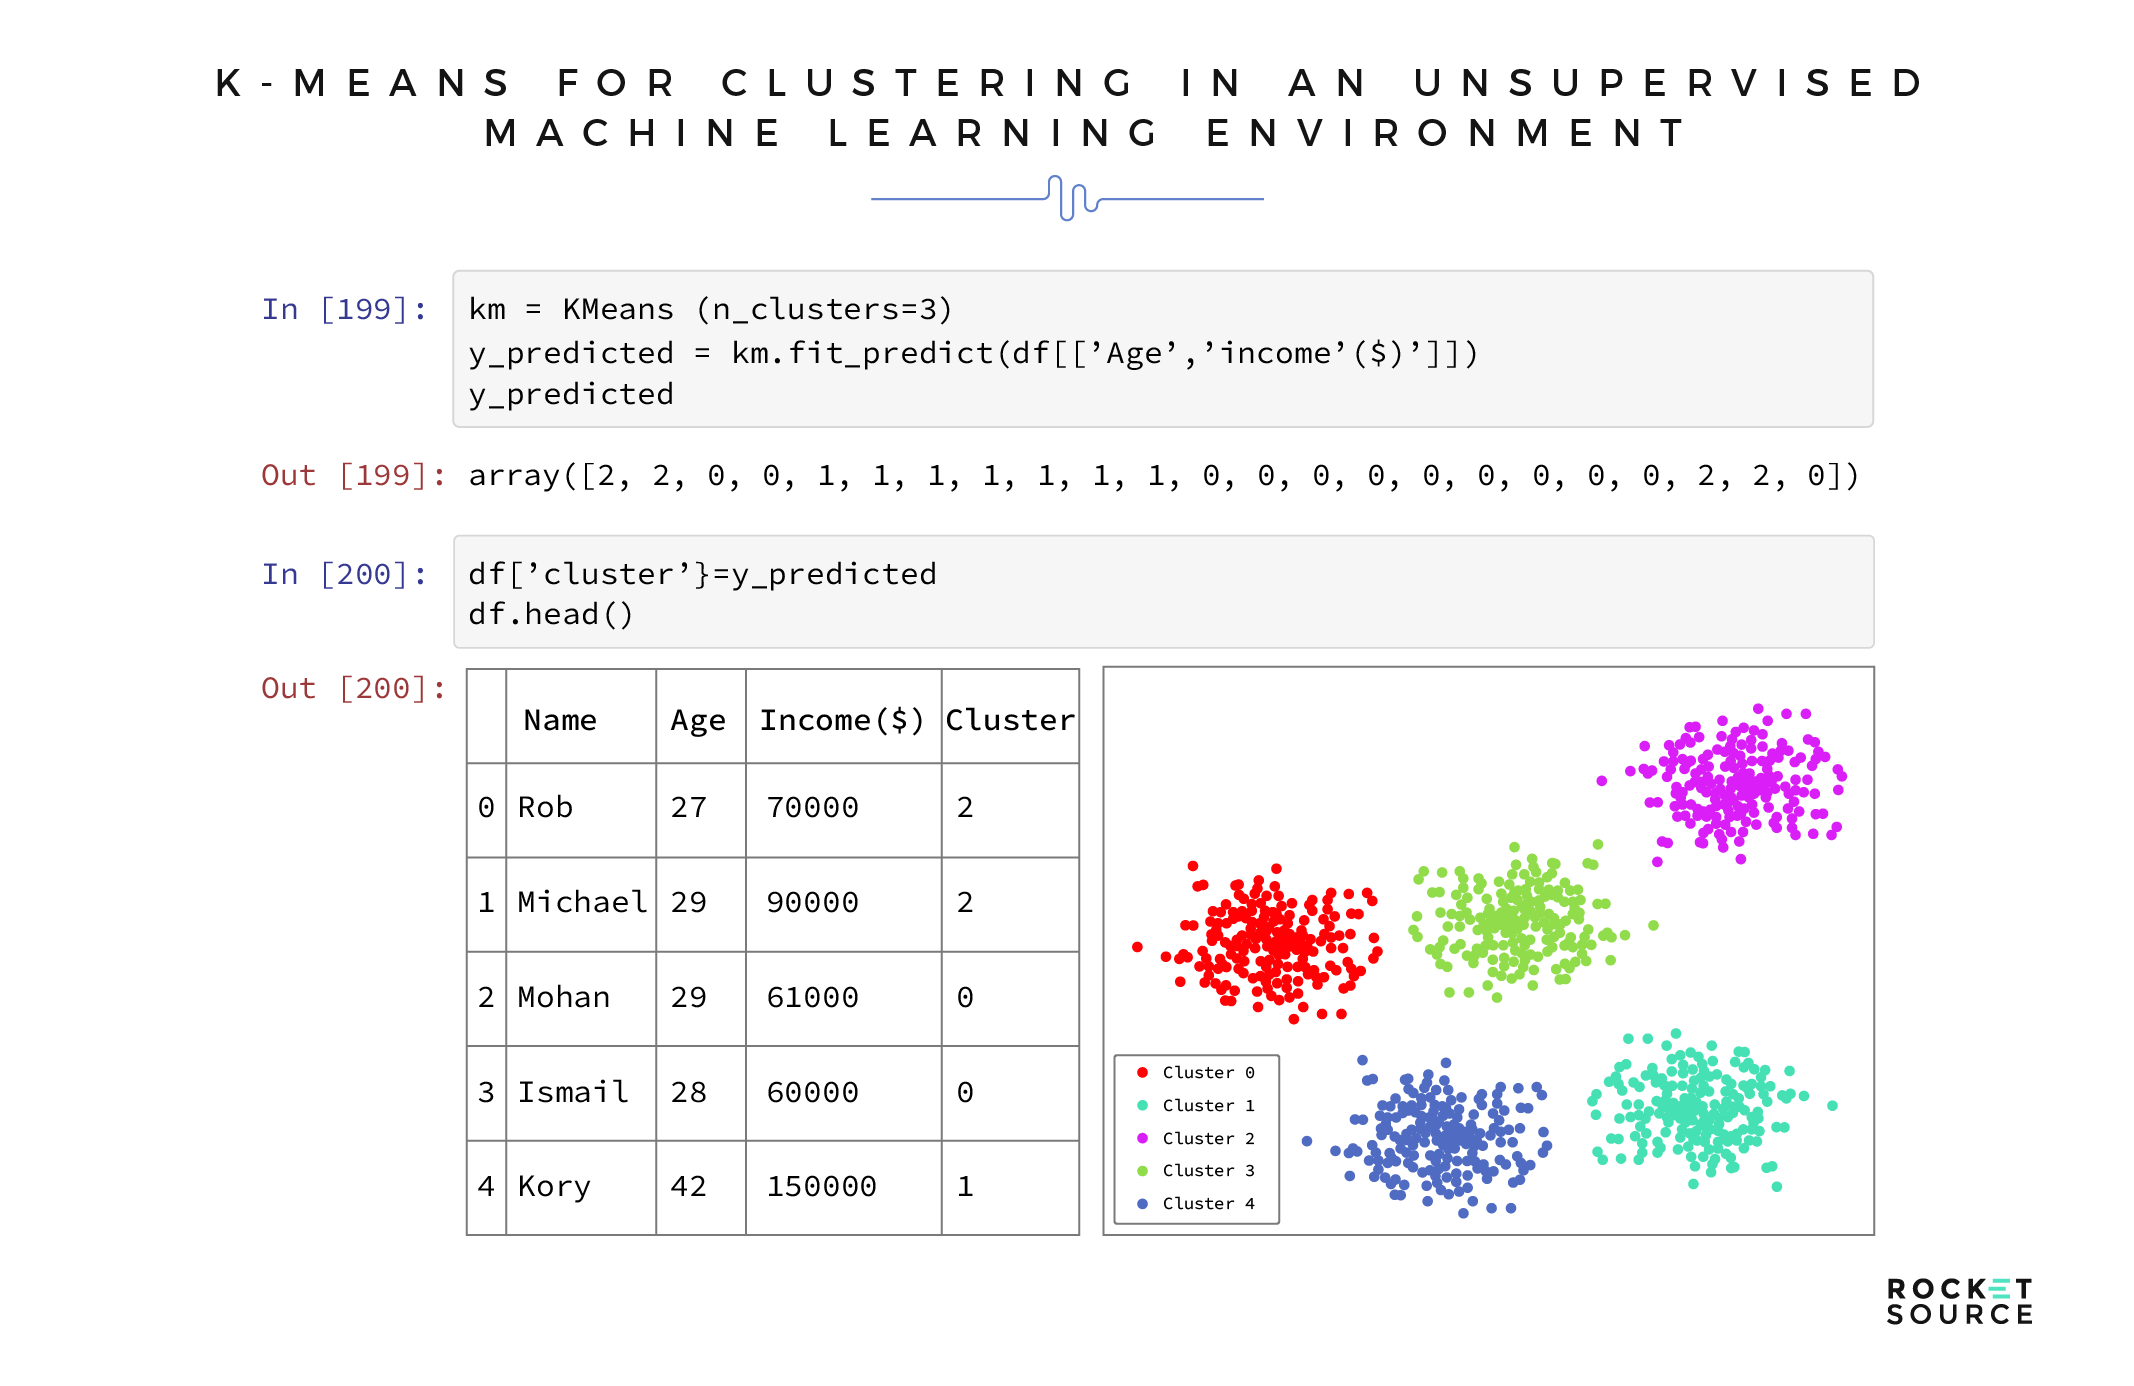
Once we clustered out our various cohorts, we could work toward inferring the characteristics of each cluster using the association algorithm. This algorithm applies business value in the form of action. For example, we’d be able to identify purchase patterns from each of our various cohorts and drive initiatives based on that predicted behavior.
Semi-Supervised
Semi-supervised learning is a combination of unsupervised and supervised learning. As in a supervised learning environment, some of the data is labeled. Other data remain unlabeled and rely on the algorithm to draw conclusions from patterns within the data.
A semi-supervised learning environment can reduce the cost of storing labeled data while still offering algorithmic insight to formulate conclusions to solve business questions.
An example of what you can find in a semi-supervised environment is sentiment. By taking a labeled dataset around the general sentiment of a customer and aligning it with a larger unlabeled dataset of social verbiage, the algorithm can continuously predict whether a customer is happy or upset.
Once you know what you’re trying to solve for and the type of model that makes the most sense to build, you can start outlining your approach.
The Importance of Framing, Scope Development and Problem Definition in Machine Learning Models
Phew! We’ve made it through the technical side of things and are now onto one of our favorite aspects of machine learning and predictive modeling — framing the problem you’re aiming to solve.
Organizations aspire to build and deploy a multitude of machine learning models. Because there are so many, it can be difficult to know where to start. Some people argue that starting with top initiatives of the business or the most critical metrics is best. While it’s valuable to have identified a model, we argue that you must dig deeper by asking more questions up front, such as:
- How do you plan to identify the target metric for which you want to predict?
- How do you define the limitations of the target metric?
- What level of context and data breadth are you able to include?
- Is there any third party data we can leverage to add incremental value to the model?
- How can we assimilate insights (from both the development and deployment) of our model into the appropriate communication lanes, processes and organizational materials/literature to allow for digital economies of scale?
It’s imperative that you frame a question or objective so that it’s conducive to predictive modeling. To illustrate this point, let’s use the example of customer churn. After you determine that you have a problem with high customer turnover, what are your next steps? Yes, you want to build a model to help you understand which customers have left and predict which customers are most likely to churn, but before you can do that you must define churn.
As with so many elements of the modern marketing funnel, churn will vary depending on the business model. By definition, churn can happen across a range of transactions, such as regular product purchases, visits to a hotel, maintenance on a vehicle or renewing a subscription. No matter the case, the definitions and parameters specific to that given model are imperative. With the proper curation and configuration of the data, the ability to build and deploy accurate, relevant models increases. Further, ensuring that the appropriate stakeholders across the business are involved in this part of the modeling process will make the outcomes more relevant and increase the chances of adoption as the process matures.
Framing and adding context to your data and will give you more accurate results from predictive machine learning models.
This is an important point, so we’re going to consider a few different business models to specify what it means to frame a given question appropriately and define parameters accurately.
First up, let’s look at the definition of churn. Considering a subscription-based Software as a Service (SaaS) model, how would you define a churned customer? The easy answer is one who simply does not renew after expiration. But let’s deepen that definition. Is it considered churn when a customer doesn’t renew initially because their credit card had expired but then returns after three months with a new card? Probably not. On the flipside, consider a vehicle repair business model. How often would you expect to see customers and how do you define “regularity” in terms of non-canceled customers? If a customer doesn’t come in for their oil change after three months, do you consider them a churned customer? How about six months?
Another element you must define is customer tenure. What are the minimum and maximum customer lifespans to be included in or excluded from the historic data we’re training our model on? For example, an annual subscription-based SaaS business probably shouldn’t use a non-churned customer who has only been with the company for six months, because they haven’t reached the full lifecycle of an annual subscription yet, whereas a vehicle repair shop could.
Finally, you’ll need to look at the path-to-purchase each customer took before they churned. For example, if two customers went through different onboarding cycles when starting their subscription, their path-to-purchases would not be the same experience. You’d be comparing apples to oranges, which would skew the output of the model and the accuracy of the predictions. However, comparing similar paths-to-purchase would let you identify opportunities to reduce customer turnover.
Analytical Maturity and the Importance of Self-Awareness
Some things in life get better as they mature. Fine wines, people and analytics are a few of those things. As organizations deepen their data sets and analytics, they’re able to get more value from the information they have at their disposal, thereby becoming more mature and self-aware.
Every organization has a level of analytical maturity. Knowing where your company falls on the analytical maturity scale can help you understand what data is available and identify any areas you might need to improve to drive more business value from that data.
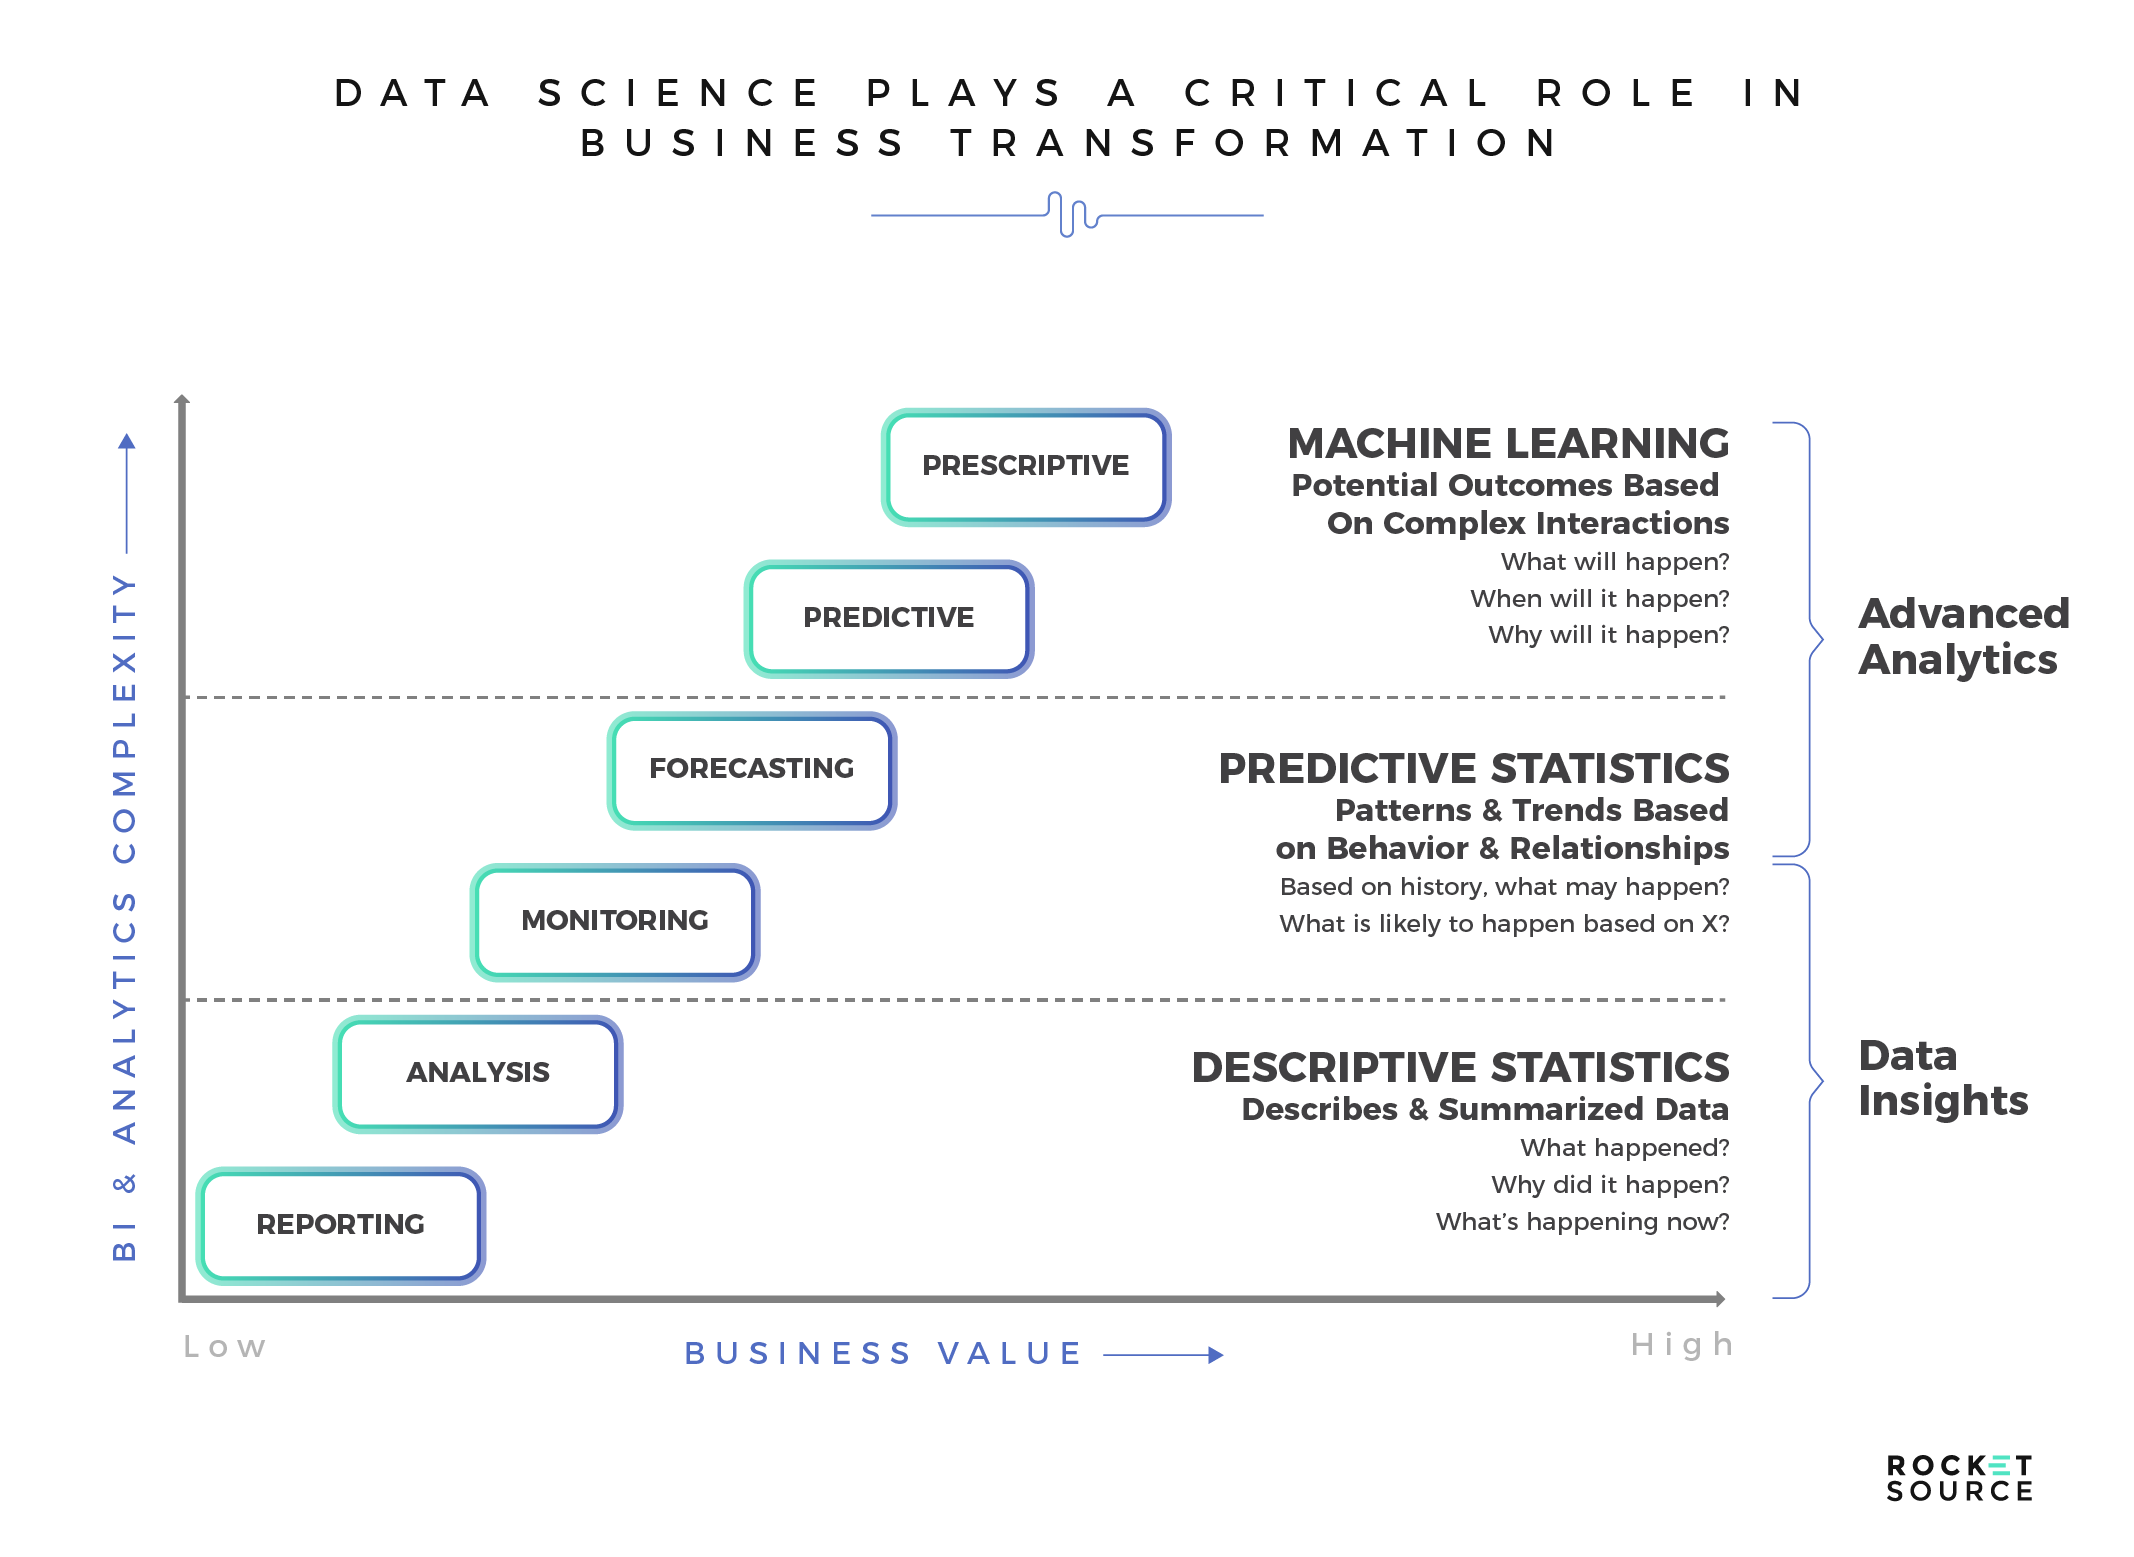
Analytical incremental climb in maturity is based on a multitude of factors spanning the cohesiveness of a business’s informational infrastructure and set of combinatory systems, which we talked about in-depth in our post about organizational growth via digital transformation. For the sake of this post, the big takeaway is this — having a fundamental understanding of current state versus future state is vital if you want to lay out short- and long-term strategies that drive incremental, digital improvement.
To drive that maturity requires you have a deep enough data set, which shows the expansion of given touchpoints. It’s these touchpoints and additional context which allow you to gain the type of insights needed to move away from basic reporting and analysis into an area where you can leverage predictive machine learning models.
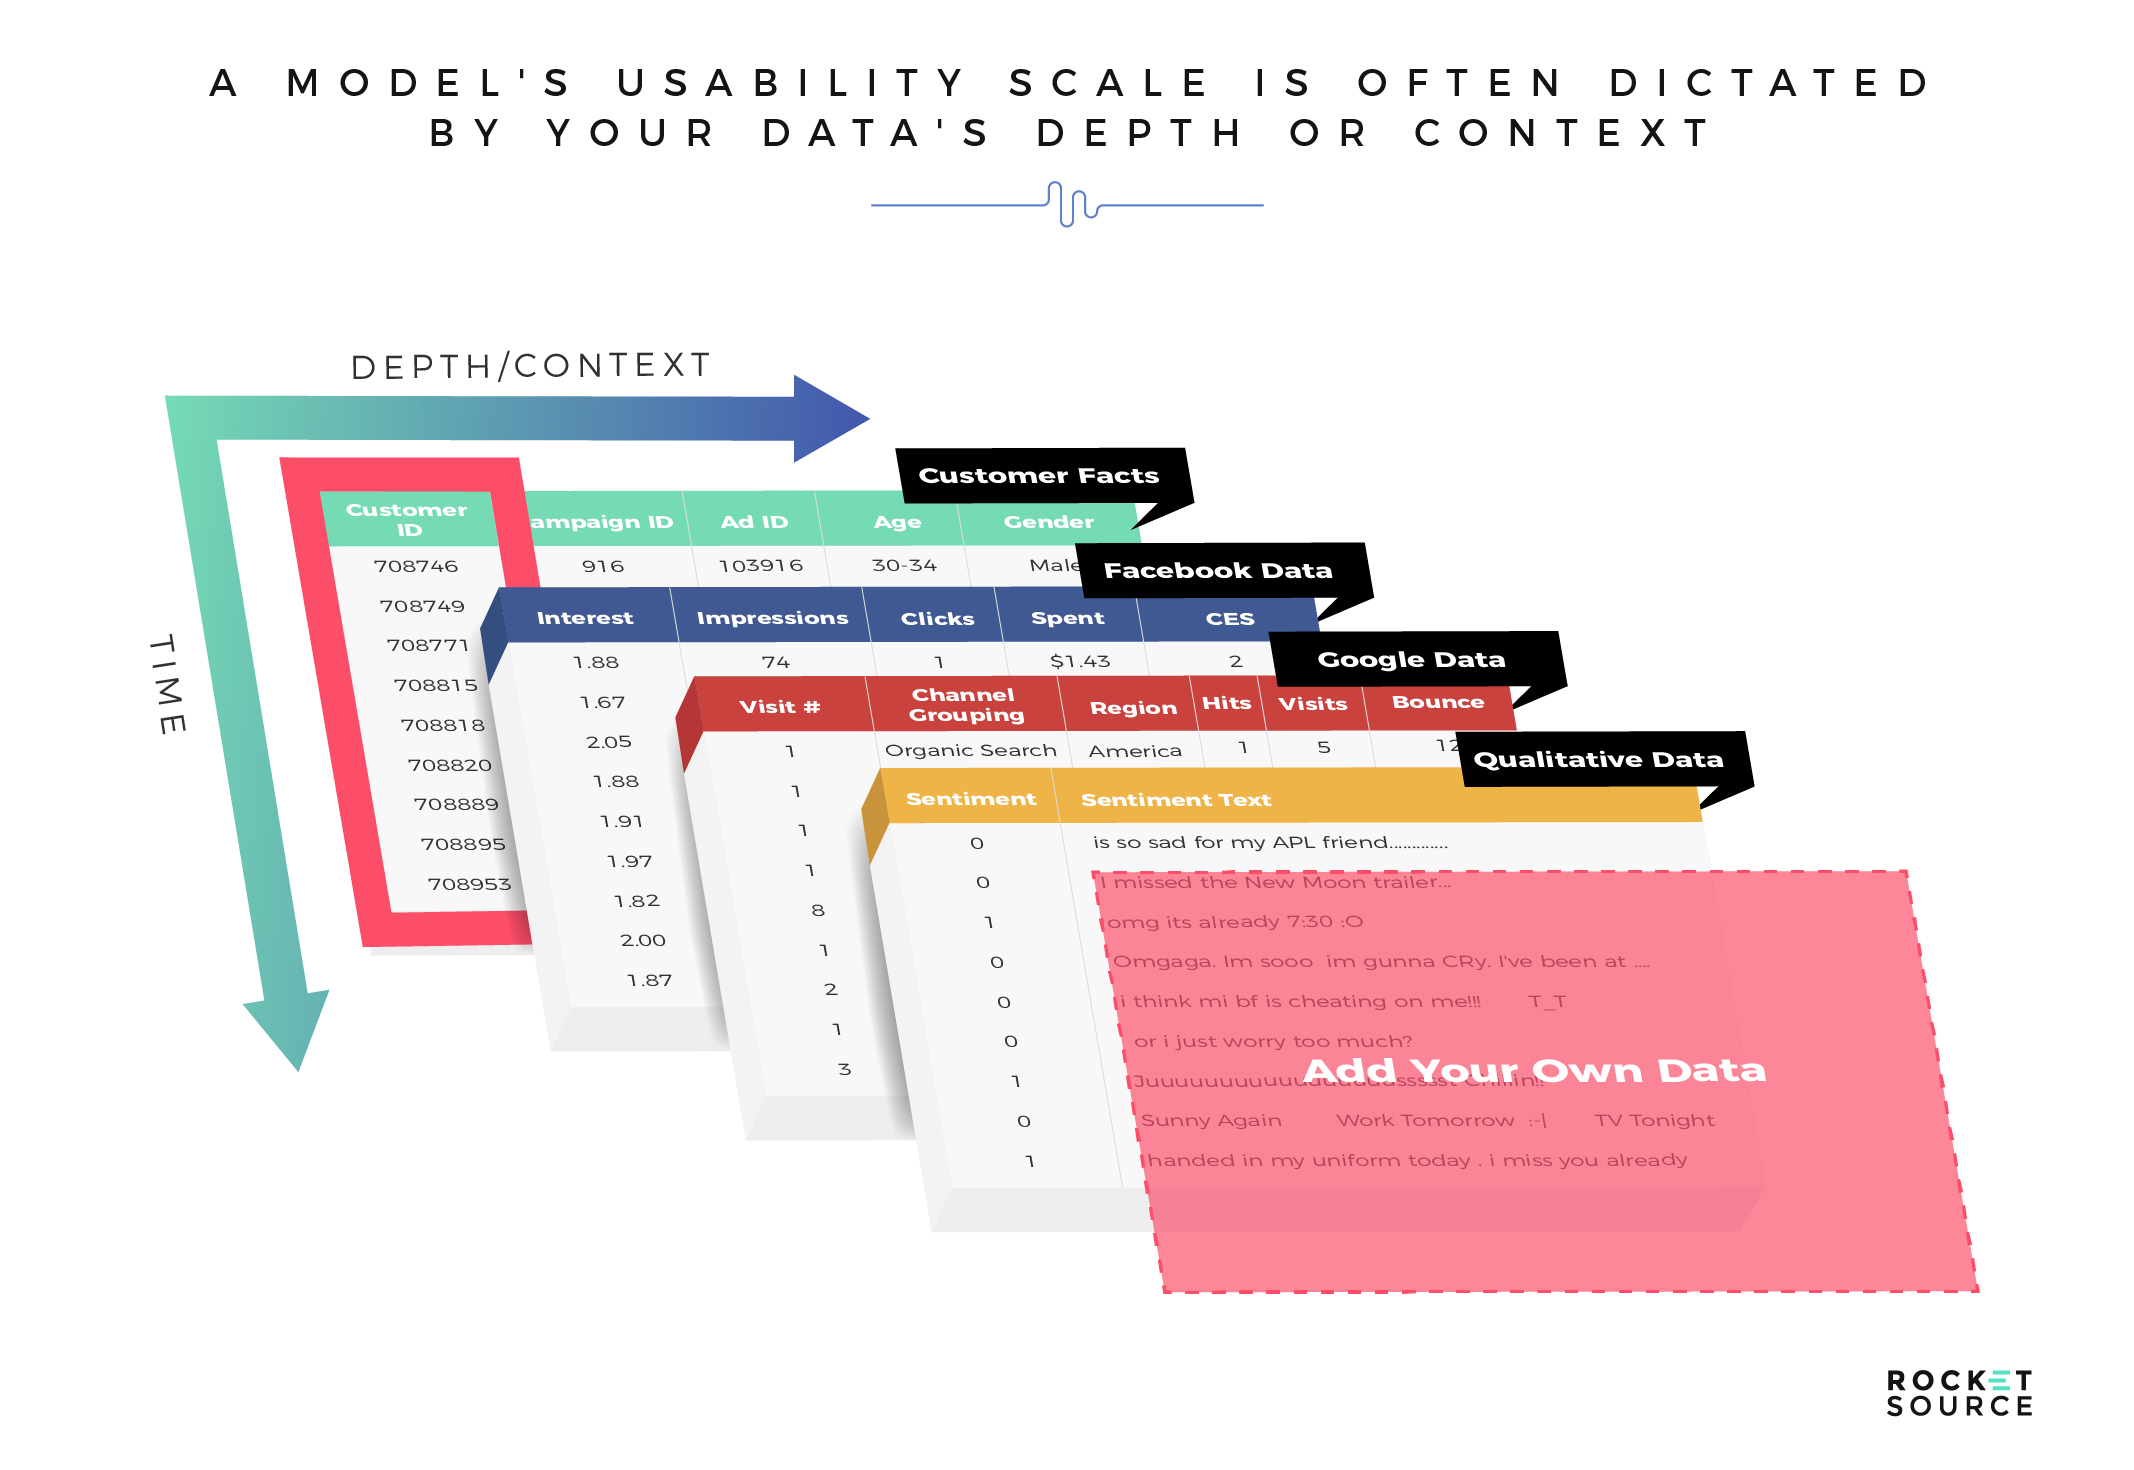
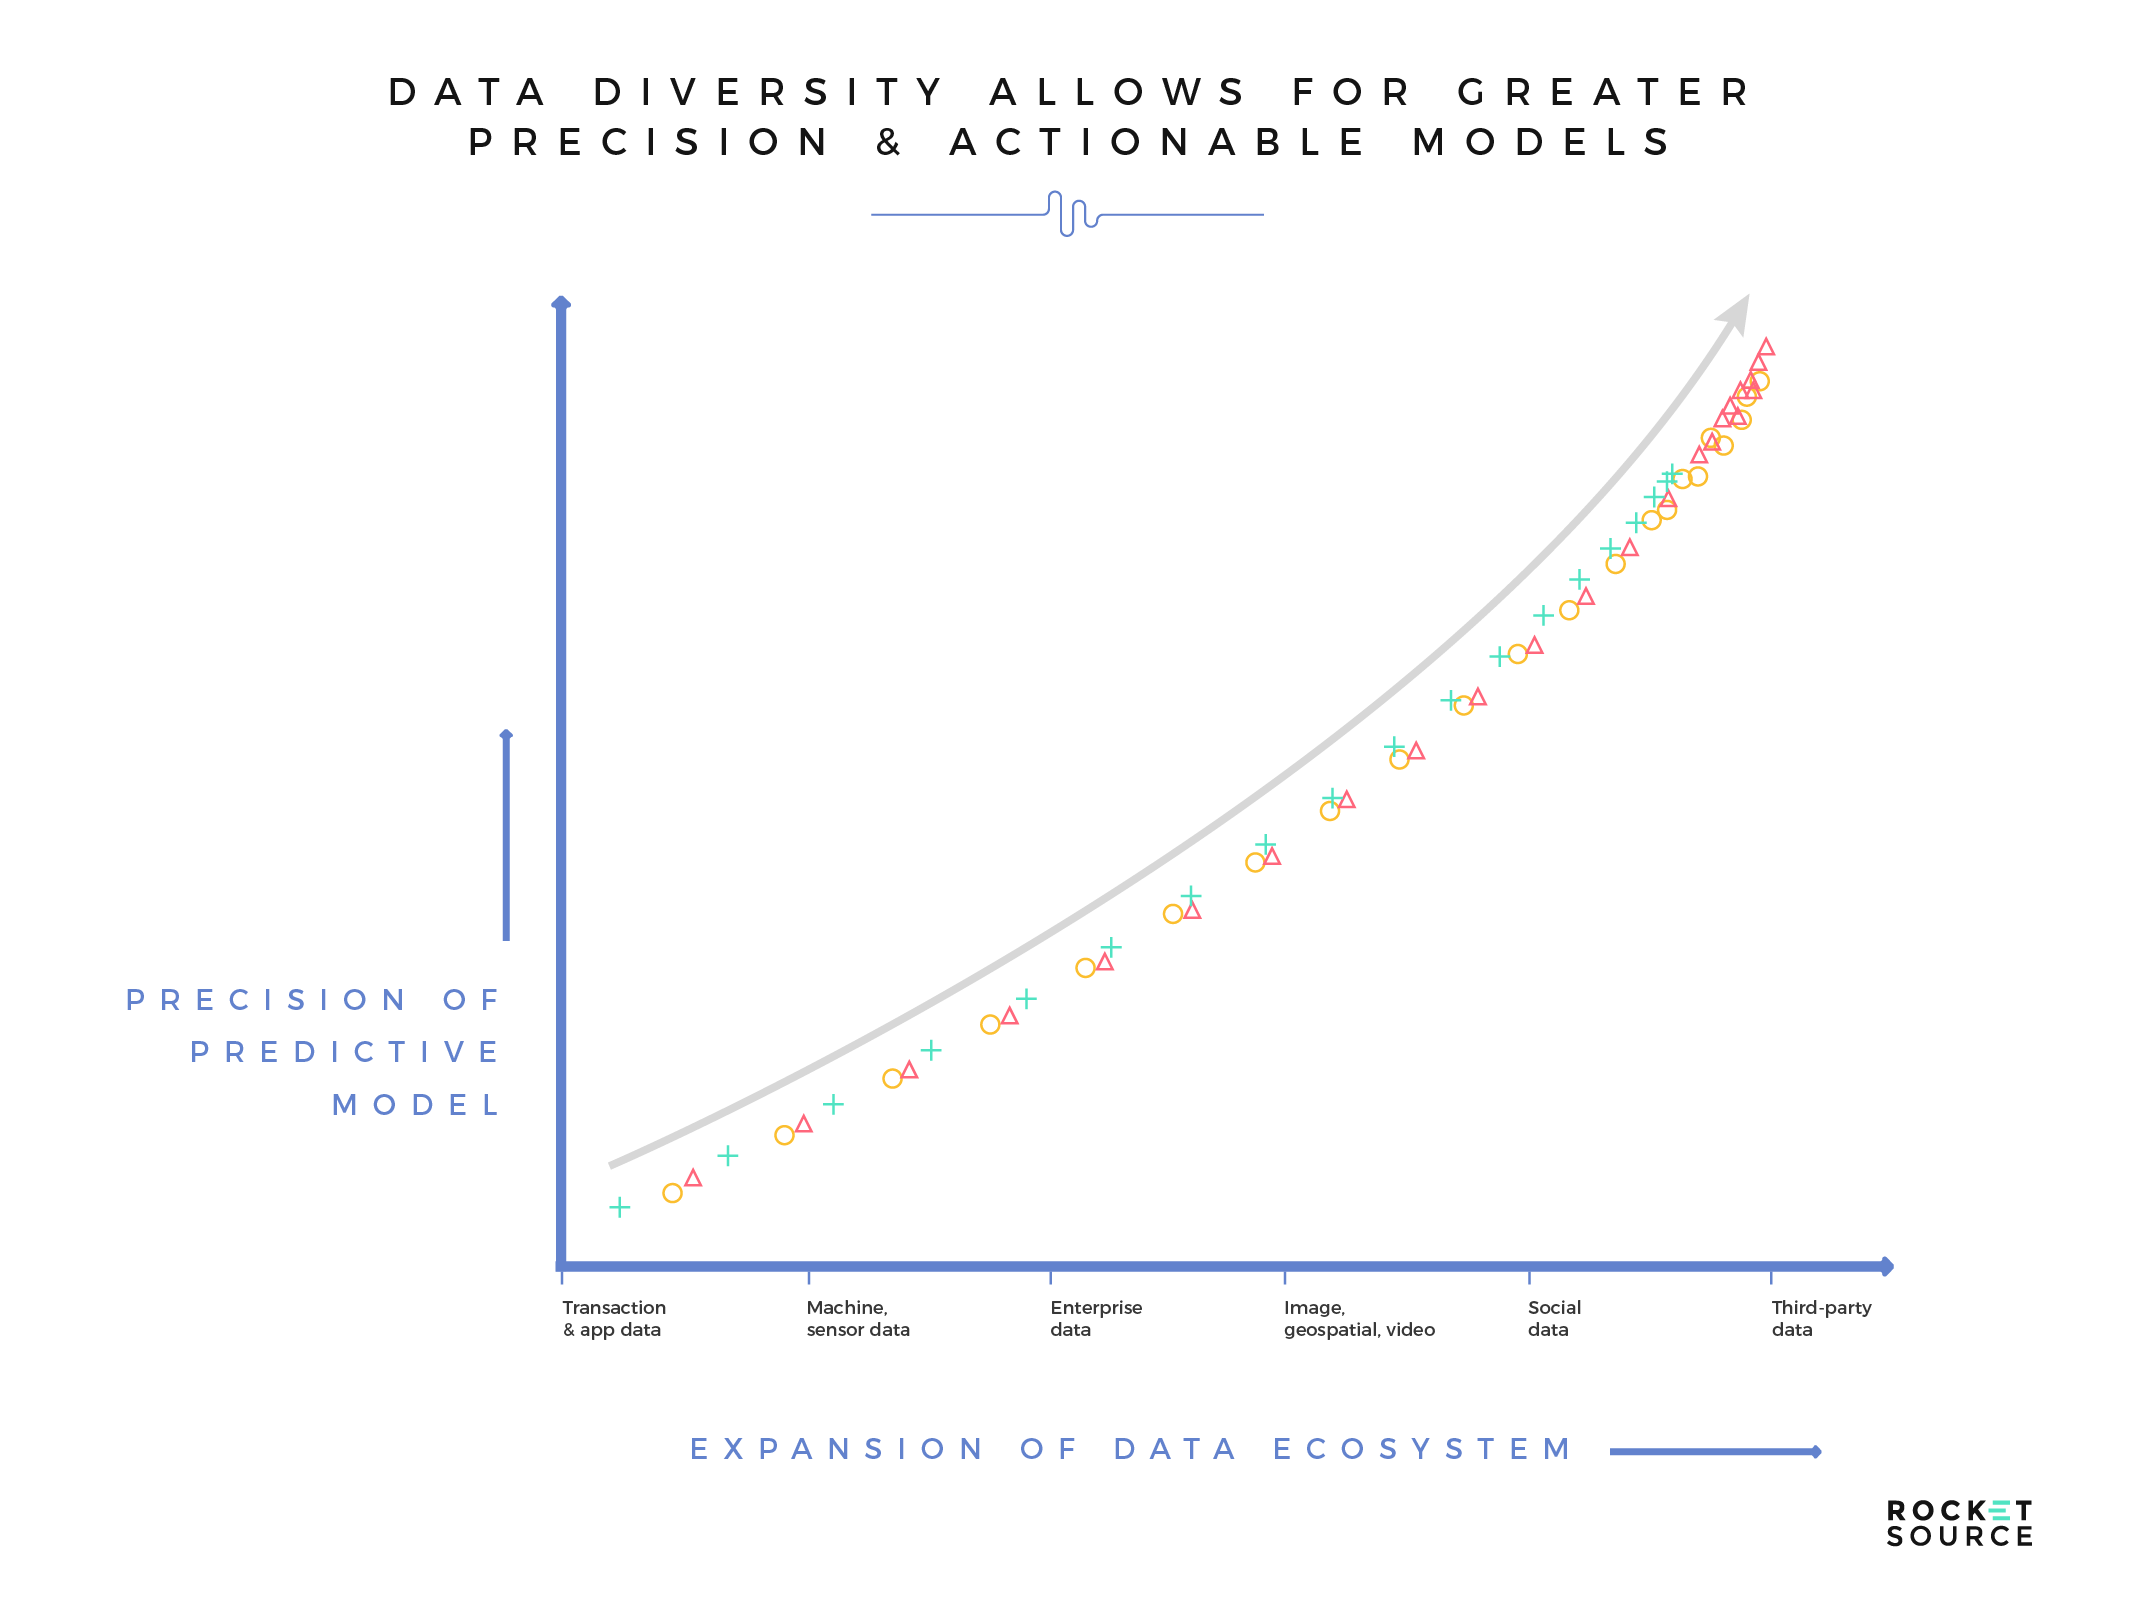
The more layers or dimension (known also as features) you’re able to add to your model’s data, the deeper you can go with your analysis. As a result, you’ll see better predictability, which in turn will bolster the accuracy and performance of a machine learning model’s output. This doesn’t happen without a noteworthy level of data diversity in the model. The more expansive or diverse the model is, the more robust the performance will be, both from a accuracy and actionability standpoint.
Any business wanting to increase their analytical maturity must develop strategies and frameworks that allow for incremental improvements by breaking down their existing organization into four key areas:
- Maintaining a consistent vision and correlating your informational infrastructure accordingly
- Championing the forward thinkers and digital rockstars
- Governing your informational infrastructure with intentional, relevance-based protocols
- Possessing incremental levels of depth and digital cohesiveness to catalyze innovation
Let’s look at each area individually.
Maintaining a Consistent Vision and Correlating Your Informational Infrastructure Accordingly
The goals of any organization can often be accomplished with real-time insights and a clear understanding of business performance at micro and macro levels. This understanding tends to come in the form of analytics and reporting. Time and again, though, we witness the ability of organizations to provide meaningful analytics being stifled by silos and misinformed data infrastructure and pipelines.
If your company’s informational infrastructure does not align directly to your short- and long-term goals or across the 3 Ps in your organization, your ability to achieve a meaningful level of analytical or digital maturity is limited. This limitation makes it difficult to maintain a consistent vision for your entire organization, which can create confusion and cause teams to lose focus. By correlating your informational infrastructure with your vision, you’re able to keep your company on track and drive more accurate predictions from your models.
Championing the Forward Thinkers and Digital Rockstars
Technological innovations are moving at lightning speed. This statement is true across your organization, but data scientists tend to feel it the most. New technology hits the scene daily, forcing your data scientists to drink from a firehose to keep up. Helping them, and your organization, stay ahead of the competition requires that you prioritize holistic modernization and training.
Companies champion their forward-thinkers and digital-rockstars are able to advance their businesses by way of analytics. Empowering everyone on your team to have a solid grip on what’s being done and why will keep the bow of your organization’s ship pointed forward.
Governing Your Informational Infrastructure With Intentional, Relevance-Based Protocols
The most intelligent businesses have long-term goals. Instead of going through one drastic change after another, they leverage analytics to make small incremental improvements over time. When taking this small-step approach, it’s imperative that a level of cohesive governance exists around the data and its corresponding processes and protocols. In other words, there should be systems in place to ensure that data is clean and relevant, while also assuring that there are change management and solicitation protocols.
One particular area for which data governance is critical is feedback loops. If you’re not using feedback loops yet, please, please, please start now. If it feels like we’re begging with that statement, we are. Here at RocketSource, we are huge proponents of feedback loops here at RocketSource. We have systems in place to allow data to be collected from internal and external users, and have designed informational infrastructure to use this data to maintain a level of relevancy and value to help propel the business in the right direction. This approach cannot happen without a properly developed governance strategy and framework.
Possessing Incremental Levels of Depth and Digital Cohesiveness
Likely the most important aspect of the last mile of any organization’s journey toward noteworthy digital maturity is the information (data) they have at their fingertips. We talk often about the context in data. What we mean is that the more information you can give to the data set — or the wider it is — the more insightful that data becomes. Wider data sets letyou zoom out to see the forest, not just the trees.
The insights afforded by wider datasets tend to result in more action-based strategies. That’s because decision makers can get an accurate, precise, clear view of what’s happening in and around all that big data. But getting context and accuracy around your data requires a cohesive digital infrastructure of your data repositories. As we dive further and further into a platform-rich world, data is being accessed from multiple places and instruments. The higher the disparity of systems, technology and data across an organization, the less context and depth in its data. Combining repositories and leveraging a solid framework to deploy your models ultimately dictates just how insightful you can get.
A Framework for Deploying Machine Learning Predictive Models
When pulling together the framework to deploy a predictive model, it’s imperative you have your 3 Ps in place. Remember those from earlier in this post? They’re your people, processes and platforms. In addition to the 3 Ps, your data pipelines, data governance and digital infrastructure must be properly built out. This proper build out can’t happen without using the appropriate operationalization precepts.
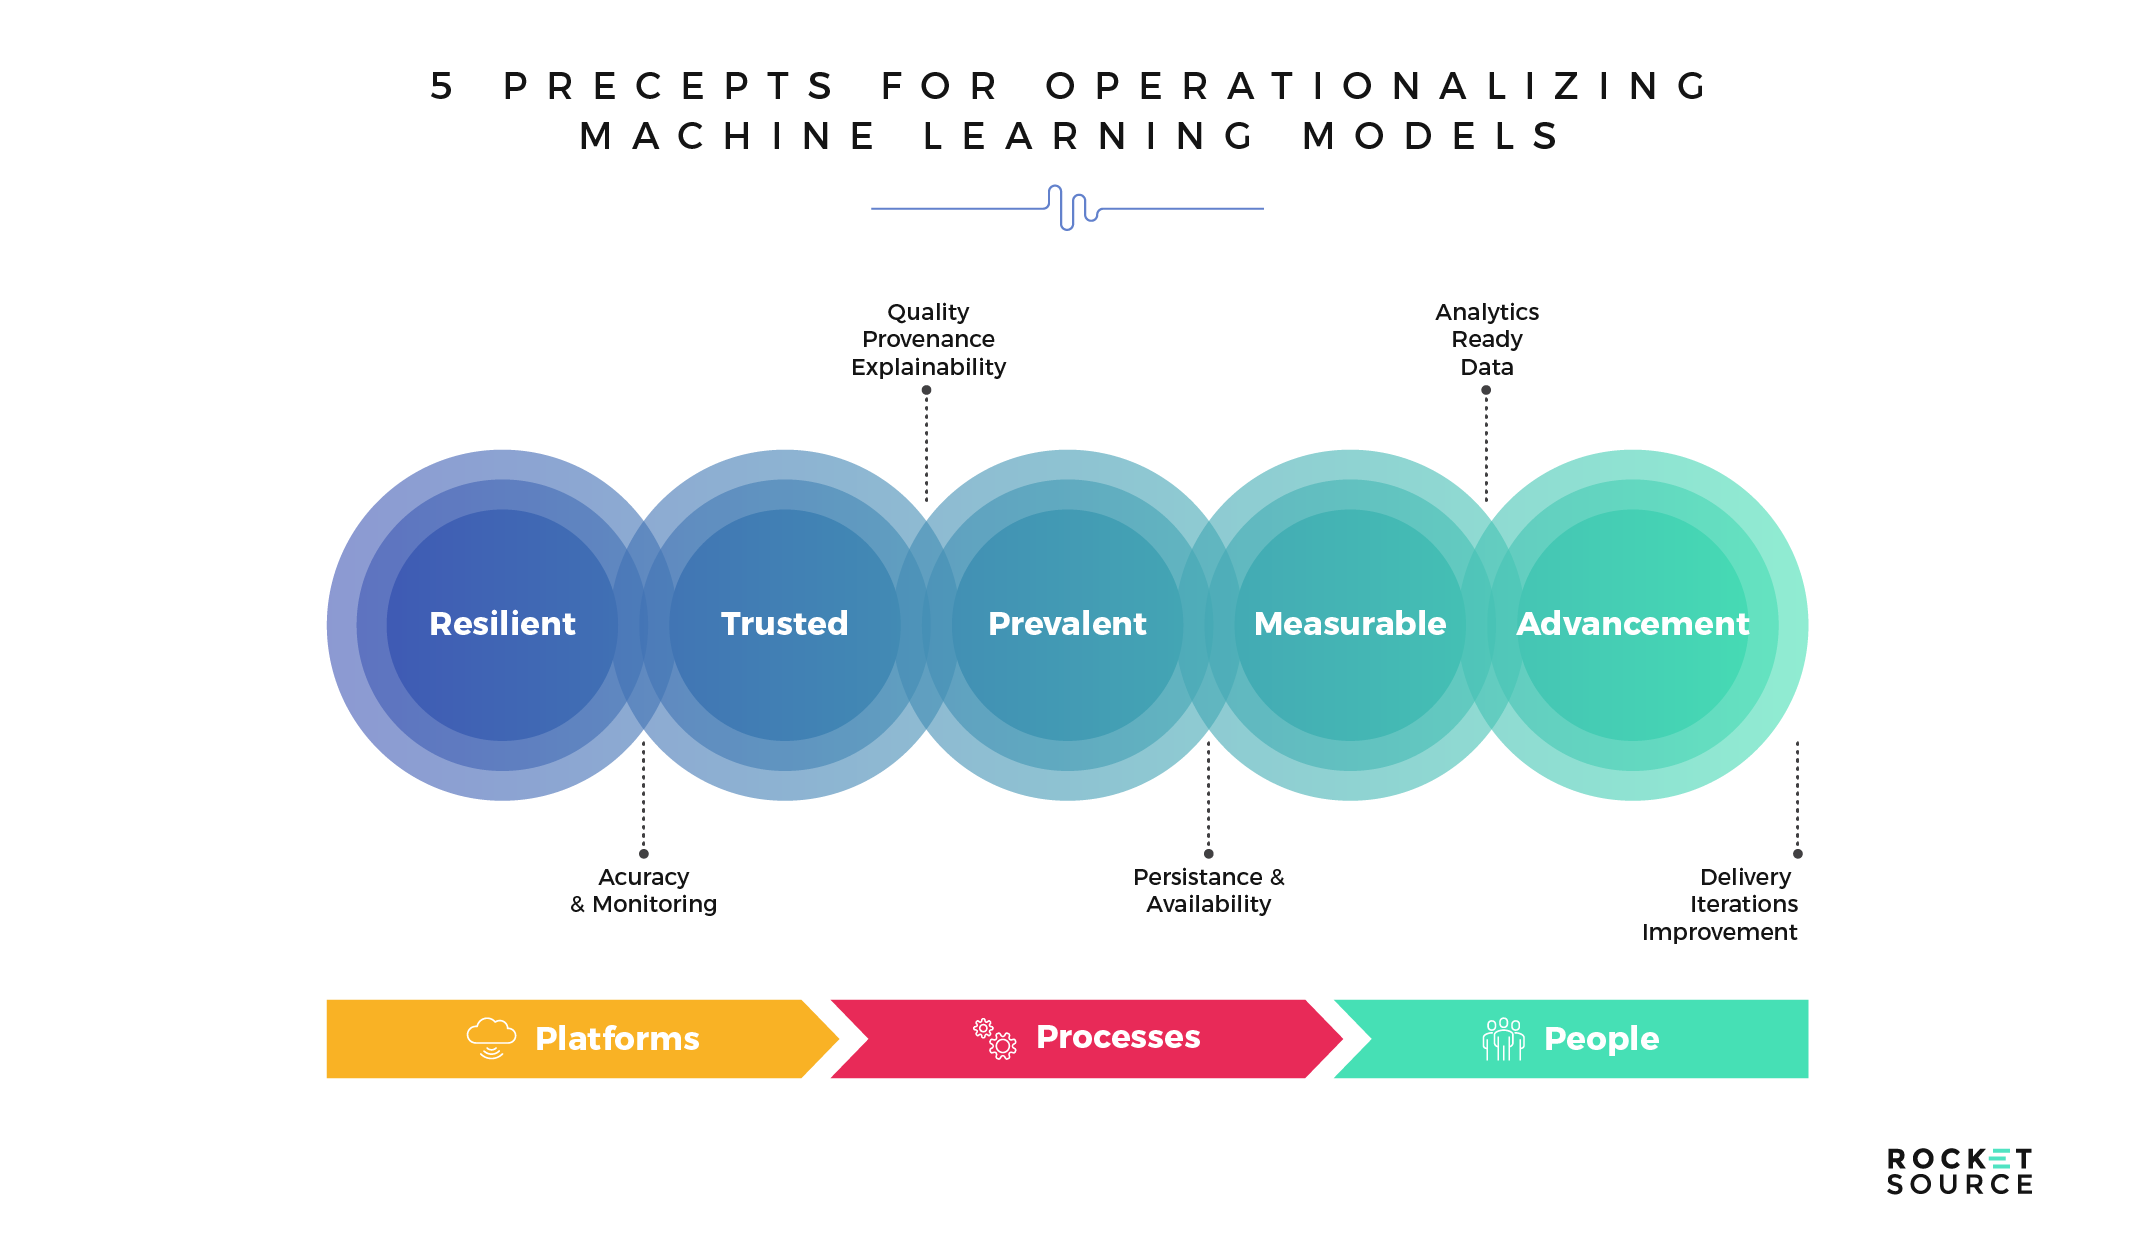
We try very hard to avoid excessive jargon around here. When we say ‘operationalizing’ your machine learning models, we simply mean setting concrete parameters around how you put your data in motion and then leveraging and disseminating those parameters across team structures. These parameters turn fuzzy concepts into something more concrete. As you start to wrap your head around how you’ll use your machine learning models to drive action in your organization, these are the general parameters you’ll want to stick to throughout the process — resiliency, trust, prevalence, measurability and advancement.
Resiliency
First and foremost, the informational infrastructure you have in place must be resilient against any disruptions, such as accidental tweaking of data sets due to a lack of data governance or delayed and disjointed third-party collection methodologies.
As your data arrives from outside sources, platforms or methodologies, it must remain clean as it gets pushed through the data pipeline. By ensuring resilience up front, you’re in a better position to recover from any possible disruptive events in a timely fashion.
Before deploying any machine learning model, you must ensure resiliency in your informational infrastructure.
Trustworthiness
In addition to having a resilient pipeline, you must ensure the data arriving on the other side is trustworthy. As the saying goes, dirty data in means dirty data out. It’s critical that you have parameters in place to ensure you’re leveraging accurate data sets to drive accuracy in your modeling. It’s only through trustworthy data that you can infer the results of a given model by a business user.
Quality is key when it comes to achieving a meaningful level of trustworthiness in the data. By quality, we don’t just mean accurate data. We mean relevant data too. This relevancy comes as a result of having an expansive context around your data sets, as we discussed above. Knowing where your data originated is critical, even if it’s immature when it first arrives in your pipeline. The goal is to ensure that the features and outputs of a given model have (or are) valuable and relevant in a given business context. This context allows data scientists to make the data and the model’s findings explainable to a business layman, dramatically increasing the likelihood that the model will add value in a business setting.
The ability to explain a given prediction, engineered feature or a fit statistic in a machine learning model is critical.
Prevalence
Think of your organization as a beautiful tapestry. In order for the picture on the tapestry to have meaning and clarity, data must be leveraged consistently and cultivated regularly for newfound insights that drive improvement and innovation. It’s here that the 3 Ps really come to light.
The people of an organization must understand how specific data can facilitate informed decisions and a more optimal day-to-day work environment, such as given OKR achievements or marketing milestones. The processes of an organization can continually be made more efficient, reducing wasteful steps while still enhancing profits. In order for this to happen, the most critical and insightful data points must be assimilated into the key processes of a business. This assimilation must happen in a way that feels natural and non-disruptive to the end-user. In other words, you can’t ask your people to change their normal operational behavior to consume new reporting and expect stellar results. Instead, having a well-documented set of processes and inter/intra relationships across the organization will help properly articulate the who, what, where, when and why of marrying an organization’s operations with its informational infrastructure.
If you skip this step, you’ll miss a giant opportunity. Infusing a level of familiarity and proficiency in using data to make decisions and take action in a regular business setting is a foundation that every organization can lean on when adding advanced analytics and predictive modeling to daily operations.
If data are not prevalent across the inner-workings of an organization, there’s a limited ability to mature to a point at which machine learning models are being leveraged.
Measurability
Ultimately, there comes a point at which the business has to define measurable outcomes at both macro and micro levels. It’s this measurability that helps demonstrate the ROI of a machine learning model and gain buy-in across the organization. Without the ability to leverage data to measure performance against outcomes, it’ll be harder to get your team on board with the cultivated, direct and tangential insights that are byproducts of machine learning models.
It’s important to note here that data as an informational asset is not what propels an organization into analytical maturity. But when specific, measurable definitions are created such that the data can be leveraged to drive transparency and context around critical metrics, the ability to move faster and in a more informed manner becomes reality.
Performance measurement improves the overall effectiveness of an organization’s core operations and gives way to tangible results.
Advancement
The advancement of your organization’s informational infrastructure only happens with the proper development and configuration of a few critical areas — your data, rules, platforms and architecture.
First and foremost, you need to have proper data collection methodologies in place. Remember that we said feedback loops were so critical? Yeah, we meant it. It’s crucial to have feedback loops in place to validate the existing data and provide the information necessary to optimize and improve the most pertinent areas of the business.
Once you have your data, defining semantic rules for your data sets ensures consistency and appropriate usage. These rules drive data governance, keeping your teams aligned so data remains clean and trustworthy. The platforms and technologies being leveraged must also be properly and consistently cited and managed. If platforms and technologies are not used and their capabilities not maximized, it’s very difficult to realize the value of an appropriately configured informational ecosystem and infrastructure. To this end, the architecture of the overall set of technologies, infrastructure and operations must be continually iterated upon to let growth happen in a natural way.
Advancement only happens after your data, rules, platforms and architecture are properly developed and configured.
The way you engineer your data matters. If your data sets are not prevalent and pervasive, it will be nearly impossible to continuously make the most relevant data available to the model, which can skew your team’s ability to measure outcomes and advance the organization. Bringing it all together with these five precepts (resiliency, trustworthiness, prevalence, measurability and advancement) in place ensures forward momentum for your organization — but it takes the right people in the right seats on the bus to push down on the gas pedal.
Successfully Deploying Machine Learning Models
There are various opinions and assertions out there regarding the end-to-end process of building and deploying predictive models. We strongly assert that the deployment process is not a process at all — it’s a lifecycle. Why? It’s an infinite process of iterations and improvements. Model deployment is in no way synonymous with model completion. We will go deeper into the reasons for this in the section below as we address the requisite steps for operationalizing a model, but the high-level post-deployment steps are called out in the following diagram. Here’s what that deployment looks like in action:
Validating Your Machine Learning Models With Fit Statistics
Once a model is built, inferring the results is imperative. When we refer to model inference, we’re actually addressing the importance of understanding why a model is performing in a specific way. This drills down into the takeaways of critical fit statistics that lead to proper business translation and, ultimately, to a fundamental, mathematical, technical and data-level understanding of the model itself. Knowing this will serve you well when maintaining a model in the wild. To this end, it’s imperative you’re able to analyze the model’s fit statistics and metrics in an educated and informed manner. These metrics will tell you how effective your model is at making predictions around your specific business outcomes.
An important note before we dive in: in this section, we’re addressing the more common fit statistics specific to the models at the end of the post, which are all primarily supervised learning on structured data, and which range from classification to continuous numerical (regression) problems. There are specific commonly calculated fit statistics for each model type.
Fit Statistics for Classification Models
A classification model involves predicting a class, such as labels or categories, by mapping a function (f) out of input variables (x) to output variables (y). For example, you can classify a woman as either being pregnant or not being pregnant. There is no in-between.
To know if the model is giving you the most accurate results (i.e., not spitting out false negatives or false positives) you must analyze your predictions using one or more of the following metrics:
- Confusion or Error Matrix
- Accuracy
- Recall or Sensitivity to TPR (True Positive Rate)
- Precision
- Specificity or TNR (True Negative Rate)
- F1 Score
For the sake of this post, we won’t go into each of these in-depth. However, if you’re running a classification model, it’s critical that you analyze a variety of these metrics to determine whether your model is producing accurate, precise results you can confidently rely on to predict the direction for your business’s success.
Confusion Matrix
A confusion matrix is a table that articulates the performance of a classification model. The graphic is called a “confusion matrix“ because it quickly makes clear where the algorithm is confusing each class.

If you’re not used to reading a confusion matrix, here’s a quick rundown of what it measures:
- True Positives (TP): the actual class of the data point was True and the prediction is also True
- True Negatives (TN): the actual class of the data point was False and the prediction is also False
- False Positives (FP): the actual class of the data point was False and the predicted is actually True
- False Negatives (FN): the actual class of the data point was True and the predicted is False
Depending on the model, business goal and overall scenario, you will likely need to adjust certain areas of the model to minimize false negatives or false positives. There are several instances when it’d make sense to take this route. Let’s look at two.
First, consider that you’ve just set up a lead qualifications model. With this type of machine learning model, you’ll probably want to minimize false negatives because the goal of the model is to bring you qualified leads. Your sales team would rather have more leads to work with than fewer. If your model is filtering out leads as “not likely to convert” when there indeed may be a chance that a lead would convert, you’ll miss out on potential sales.
On the flip side, you’ll likely need to minimize false positives when predicting the likelihood that an individual will default on a loan. If you’re a lending institution, you don’t want your machine learning models to tell you someone is likely to default when in fact they’re not. That’s known as a false positive and could be a colossal miss if either the loan amount or the benefit to the lender is sizable.
As you filter out false negatives and false positives, your models become exponentially more valuable to your business goals. But the confusion matrix is just the beginning. There are other calculations and measures you can take to continue making your machine learning predictive models more spot on.
Accuracy
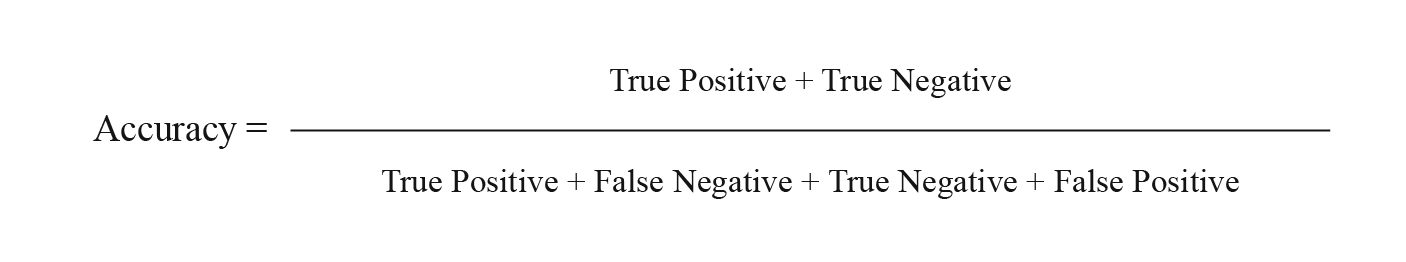
Accuracy is, in its simplest form, the percentage of total predictions that are correct. This fit statistic is a basic, but invaluable, measure of prediction quality. As you train and test the model, you’ll get values between 0 and 1, which will then be plotted on an accuracy chart that looks like this:
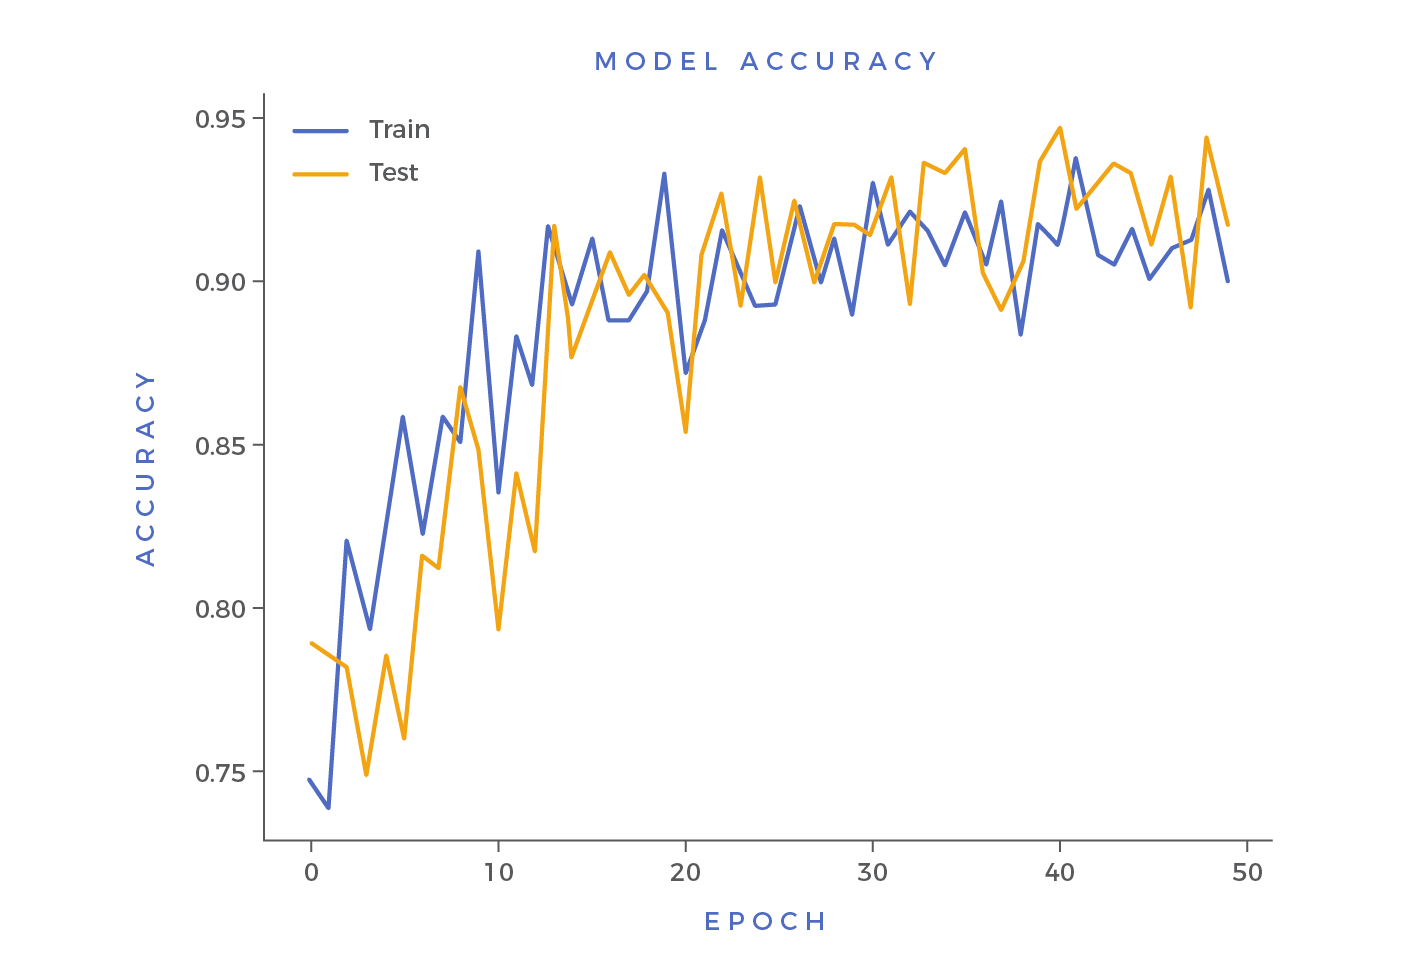
The higher the number or score, the more accurate the model. This metric gives us a fundamental idea of how our model would perform in the wild. Obviously it doesn’t make sense to lean on a model with limited accuracy, so it’s critical to test up front.
Recall (Sensitivity)
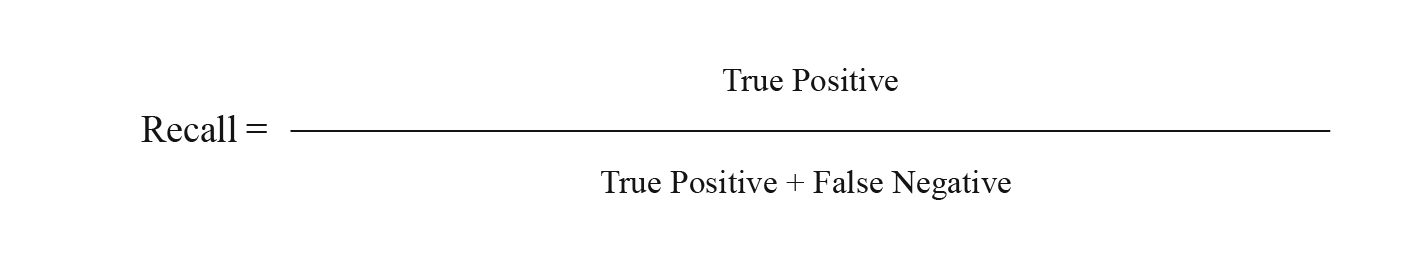
Recall is the number of records that are identified, or predicted, as positive out of the total true positives. This metric provides us an understanding of a classifier’s performance regarding false negatives, or total missed records. The importance of examining Recall is less about the identifying or predicting critical records correctly and more about giving companies more to work with. If we simply just said every lead is “likely to convert,” we would have 100% Recall but not a lot to work with.
Specificity
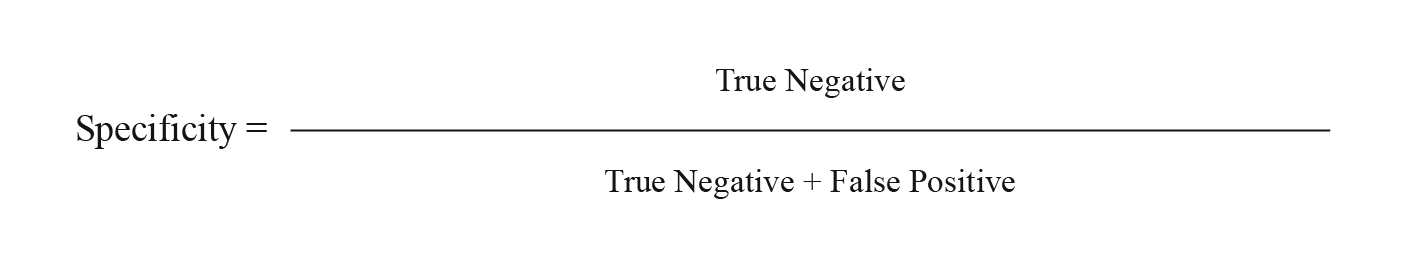
Specificity is the opposite of Recall. This fit statistic looks at the model’s True Negative Rate to determine its ability to correctly classify negatives. The result tells us the total items correctly classified as negative out of the total number of negatives.
Precision

Precision indicates the model’s ability to be precise in its results. It works by calculating the number of records correctly identified or predicted as positive over the total positive items — both true positives and false positives. This fit statistic provides us with an idea of our model’s performance by looking specifically at the total number of false positives it captured. We want precision in our models because they can help predict, and ultimately help prevent, scenarios with serious implications, such as a case of vandalism, terrorism, mass shooting or illness. The higher our Precision metric, the better our chances of stopping these and numerous other situations before they occur.
F1 Score
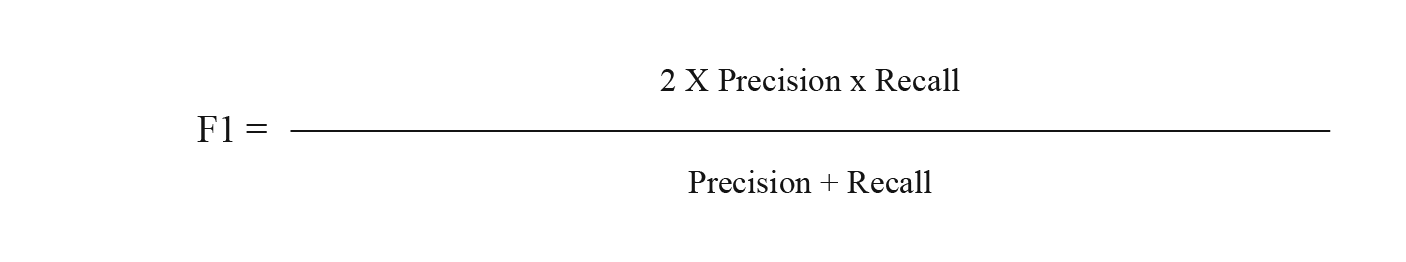
While all of the above fit statistics can be leveraged to make informed and nuanced business-level assertions about a given problem or model, it’s often nice to us, as machine learning engineers and business strategists, to aim and optimize our model around a single number evaluation metric — the F1 score.
The F1 score (also known as the F score or F measure) is a measure of the overall accuracy of a classification model. It is a classifier metric that calculates the harmonic mean (weighted average) of precision and recall in a way that emphasizes the lowest value. There’s no golden rule about whether a high F1 score is good or a low F1 score is bad. That’s because there are many factors that can influence the score, so it’s important to take context into consideration when using this metric. For example, classifiers with imbalanced precision and recall performance, like a petty classifier that has a tendency to simply predict a positive class, are at a disadvantage here. Models with a high precision score and a low recall score will achieve a low F1 score. Ultimately, the purpose of the F1 score is to reach a balance between Precision and Recall, especially for those cases with a less than ideal distribution of classes.
Fit Statistics for Regression Models
A regression model involves solving a problem contextually with a range of values by estimating a function (f) from input variables (x) into continuous output variables (y). For example, a machine learning predictive regression model would be able to tell you the dollar range a house will sell for. Note that some algorithms include the word “regression” in their names, such as linear regression and logistic regression. It’s important to know that each of these algorithms is used for a very different purpose. Linear regression is a regression algorithm, while logistic regression is a classification algorithm.
When analyzing whether this type of machine learning prediction is accurate, we must look at the baseline output of the model. There are a variety of statistics we can use to determine how accurate, and therefore how reliable, the model is. Some of the most common ones include:
- Mean Squared Error (MSE)
- Root Mean Squared Error (RMSE)
- Mean Absolute Error (MAE)
- R Squared (R2)
- Adjusted R Squared (R2)
Mean Squared Error
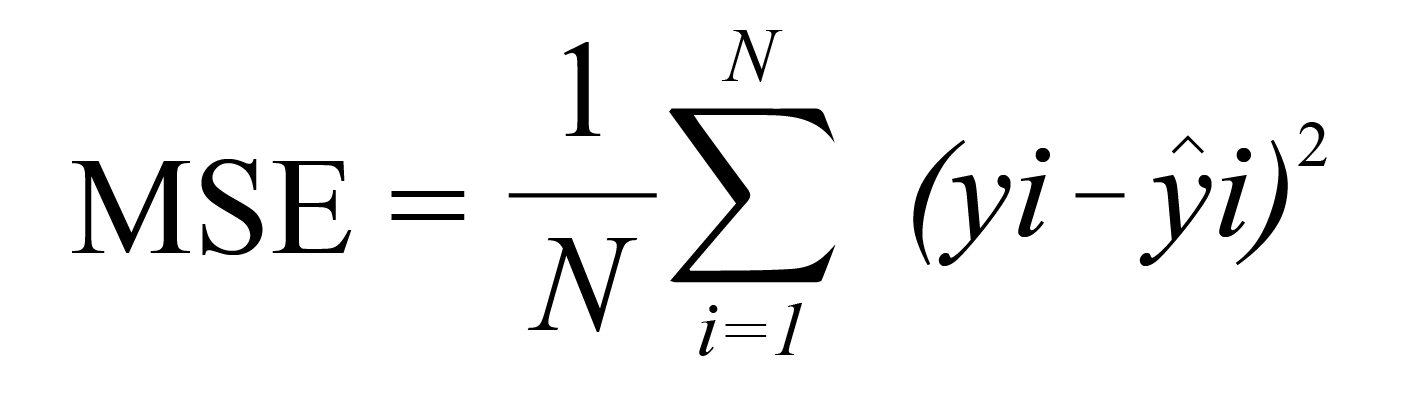
Mean Squared Error (MSE) is, for all intents and purposes, the average squared error of a model’s predictions. For each point, it calculates the square difference between the predictions and the target and then calculates the average of those values. The higher this metric, the more poorly the model is performing. This metric will never be negative because the individual prediction errors are squared. Still, the lower the metric, the better the model — the metric for a perfect model would be zero.
Root Mean Squared Error
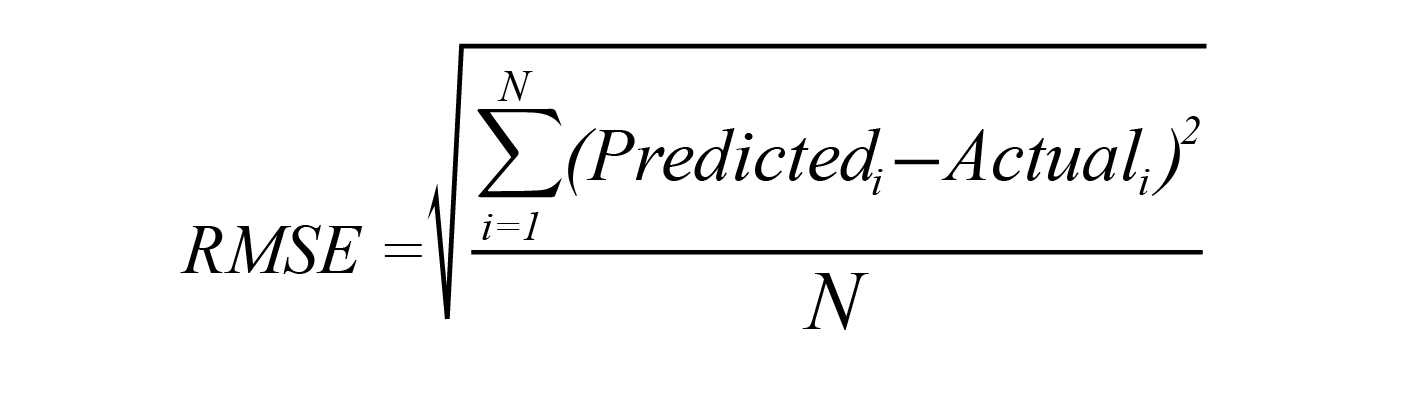
Root Mean Squared Error (RMSE) is simply the square root of MSE. We turn to RMSE instead of MSE when the risk of large errors is especially undesirable. Because RMSE and MSE are analogous with regard to the minimizers, every minimizer of MSE is then also a minimizer of RMSE. Conversely, each minimizer of RMSE is a minimizer of MSE since the square root is a non-decreasing function. To illustrate why this matters in a business setting, let’s consider an instance involving two lists of predictions, X and Y. When prediction X is greater than prediction Y, we know this will be true for both MSE and RMSE. The same relationship is also maintained in the opposite direction. Running RMSE will only help to hone in on how much greater the chances are of X happening over Y.
Mean Absolute Error

Mean Absolute Error (MAE) is calculated as the average of absolute differences between the target and the predicted values. MAE is a linear metric, which means that each of the individual differences is emphasized equally across the average. For example, the difference between 200 and 0 will be twice the difference between 100 and 0. As stated above, this is not the case for the RMSE, for which scale and parity are the focus.
MAE helps uncover the costs in relation to large errors, though not to the degree of MSE, which is more hypersensitive to outliers. For this reason, we’ll often turn to MAE during strategic planning, industry and demand forecasting, and accounting/finance, when “errors” are taken at face value and the cost associated with them isn’t quite as high.
R Squared (R2)
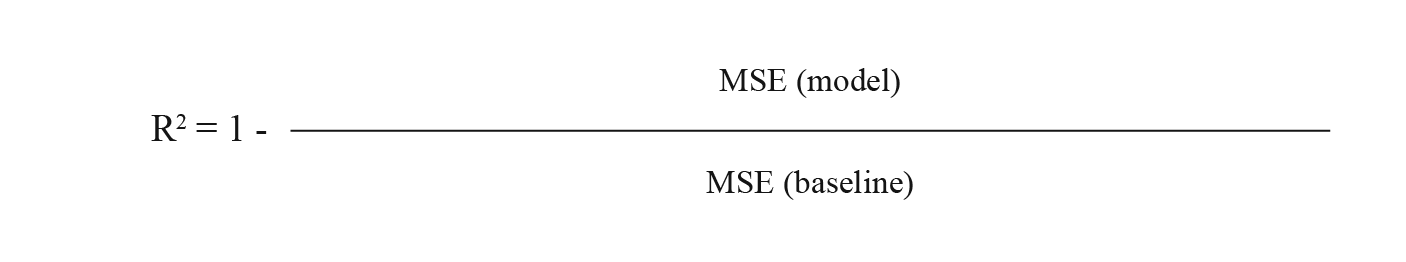
R² (sometimes referred to as “R-Two”), or the coefficient of determination, is another fit score we sometimes lean on when assessing a model. R² is the ratio between the quality of fit versus the naive model mean, which is essentially how well a given models data points fit a function or line with curvature. If this sounds a little bit familiar it’s because the coefficient of determination is closely related to MSE. A noteworthy difference here is the scaleless characteristic, which means that it doesn’t matter whether the output values are very large or very small.
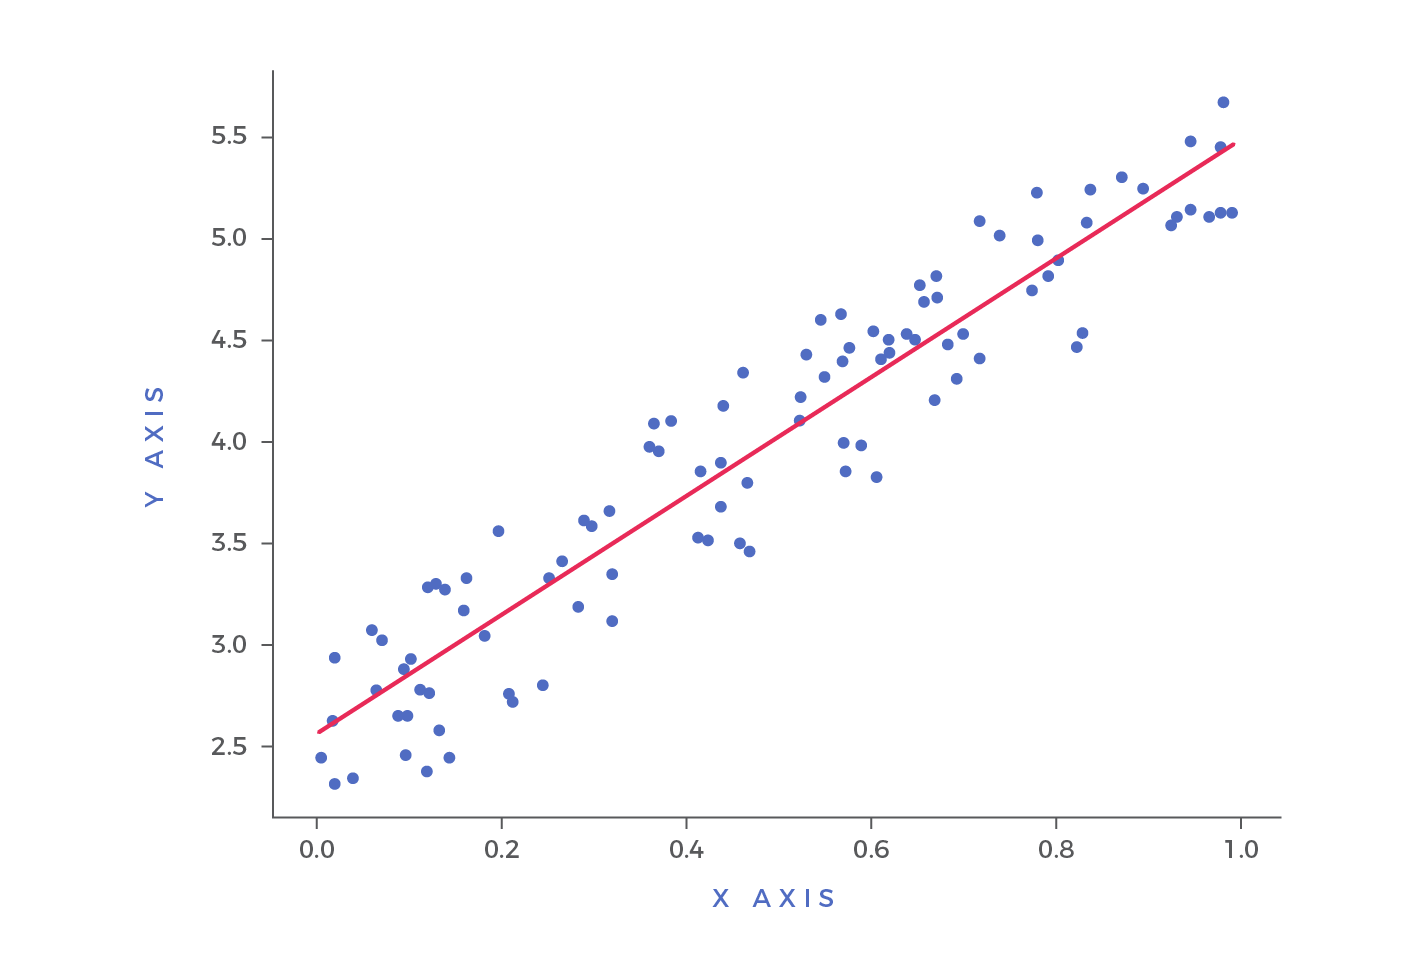
There’s a slight misconception that the confines of R² results is between 0 and 1. Even though we typically only plot R² from 0 to 1, the minimum value can actually be minus infinity. This is important to note because, in the rare instance that R² is negative, we’ll know that the model’s performance is even worse than simply predicting the mean. Consider a poorly performing model that has large negative value, even when the actual targets are positive. In this context, R² will be less than 0. While this circumstance is fairly unlikely, the possibility exists and should be noted as you leverage this fit statistic.
Adjusted R Squared (R²)
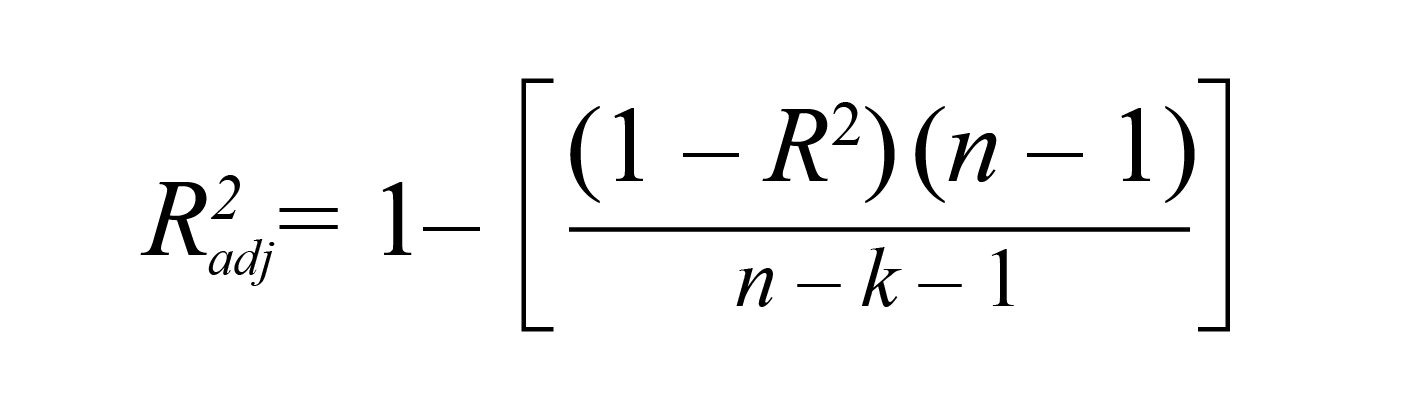
While R² articulates how a model’s points fit a function (the line you see above), adjusted R² also indicates how well those data points fit a line, but also adjusts for the number of records or data points in a model. The more poorly proportionate or performing the variables in a model are, the lower the adjusted R² will be. Inversely, the more useful variables, the higher adjusted R² will be.
It’s important to note here that adjusted R² will always be less than or equal to R². The main difference between Adjusted R² and R² is that adjusted R² will penalize separate variables that do not fit the model. This is because, in a typical regression situation, there are often cases in which it might seem to make sense to add extra variables as they come up. However, random variables can sometimes result in a broad range of significance which, in the case of adjusted R², will be compensated for by penalizing additional variables.
Whether you’re analyzing a classification or regression model, even if the fit statistic affirms the model you have in place, it’s a good idea to also ensure you’re getting outcomes and explanations you can turn into action items to move the business needle forward. To this end, having a record explainer mechanism can dramatically reduce the time it takes to draw human insight from the results generated by the models you have in place.
Using LIME to Understand a Machine Learning Model’s Predictions
Using a record explainer mechanism like Local Interpretable Model-Agnostic Explanations (LIME) is an important technique to filter through the predicted outcomes from any machine learning model. This technique is powerful and fair because it focuses more on the inputs and outputs from the model, rather than on the model itself.
LIME works by making small tweaks to the input data and then observing the impact on the output data. By filtering through the model’s findings and delivering a more digestible explanation, humans can better gauge which predictions to trust and which will be the most valuable for the organization. The process looks like this:

These tweaks and their resulting impacts tend to be what spark the interest of humans too, which means you’re able to draw more actionable and valuable conclusions based on the data you have available. It also answers why a prediction was made as well as the impact that variables have on the prediction itself. Other techniques focus exclusively on the dataset as a whole.
As LIME starts to analyze the machine learning model’s predictions, it generates a list of explanations regarding each feature in the data set. For example, if your model is forecasting a customer to have an 89% propensity to churn, LIME will give you potential reasons why. As a result, you get deeper and more actionable insight into which factors will have the biggest impact on the underlying predictions made by the model. As you start to put your machine learning models into production, you’ll be better able to understand why things are happening, why certain results are more likely over others, and where you should focus your efforts and spending.
Bridging the Statistical and Mathematical Gap Needed for Business Transformation
Let’s just take a second or two to absorb what you just consumed and bring it back to the basics. Even if you’re not a statistics or math major, it’s critical to know how the basic formulae that power much of the science behind modeling impact the precision of your models. It’s not so much the mathematics or statistical analysis that make a good model great, but rather how all of the intricate pieces of this puzzle come together to inform a truly insights-driven culture. You can probably see why we spend so much time addressing the foundation of StoryVesting and the 3 Ps, as these critical building blocks have to be done right to perpetuate and operationalize meaningful growth via digital or data transformation across an organization.
Achieving Digital Economies of Scale Via Machine Learning and Model Sequencing
Those who’ve embarked on an analytics or even on a predictive modeling journey have likely experienced, in some fashion, the “try, try again” scenario. To illustrate how events in the machine learning world often play out, we like to turn to this quote:
“Machine learning deployments are much like learning to play a musical instrument. Most often, one becomes quite proficient at the first several bars, but rarely finish the song.” – David Gonzales
As you deploy something as complex as machine learning, you’ll often start the initial work of scoping initiative X, exploring data, surfacing various levels of insights or predictions and deploying the solution into the wild. You’ll repeat this process for the next big idea, in the form of initiative Y, perhaps not realizing that much of the work done in the first initiative can be leveraged to catalyze the second, thereby shortening the timeline and offering a more informed approach. Or, in terms of Gonzales’ analogy, you could’ve learned to play the full song faster if you hadn’t over-rehearsed the first four bars.
The types of “work” we’re talking about here could fall in the range of any of the following:
- A specific set of data exploration protocols
- An outlier that was discovered and that may apply to subsequent models
- Specific features engineered for a given reason
- A given team that properly and adequately ideates
- Scopes and plans of a given initiative or model
- Specific meta-data and semantic rules or data points that are cultivated and subsequently documented and disseminated across the proper channels and teams throughout an organization
All of the aforementioned items cultivate digital economies of scale. The more an organization leverages data and analytics, the more complete, robust, accurate, usable and valuable that information becomes. As your informational ecosystem becomes more valuable and previous work is repurposed, the cost of enacting subsequent digital initiatives decreases. You end up saving time and money, which let’s face it, are two things we all could use more of these days.
As Gonzales said so eloquently in the above quote, you want to move past those first four bars and learn the entire song. Focusing on getting viable models all the way to production often produces a “chaining” effect, wherein the work that goes into building and inferring a model often results in a subsequent model, either by way of collaboration and general information dissemination or due to specific results of a model in the form of variable importance or fit statistics. To illustrate how this works, picture this scenario:
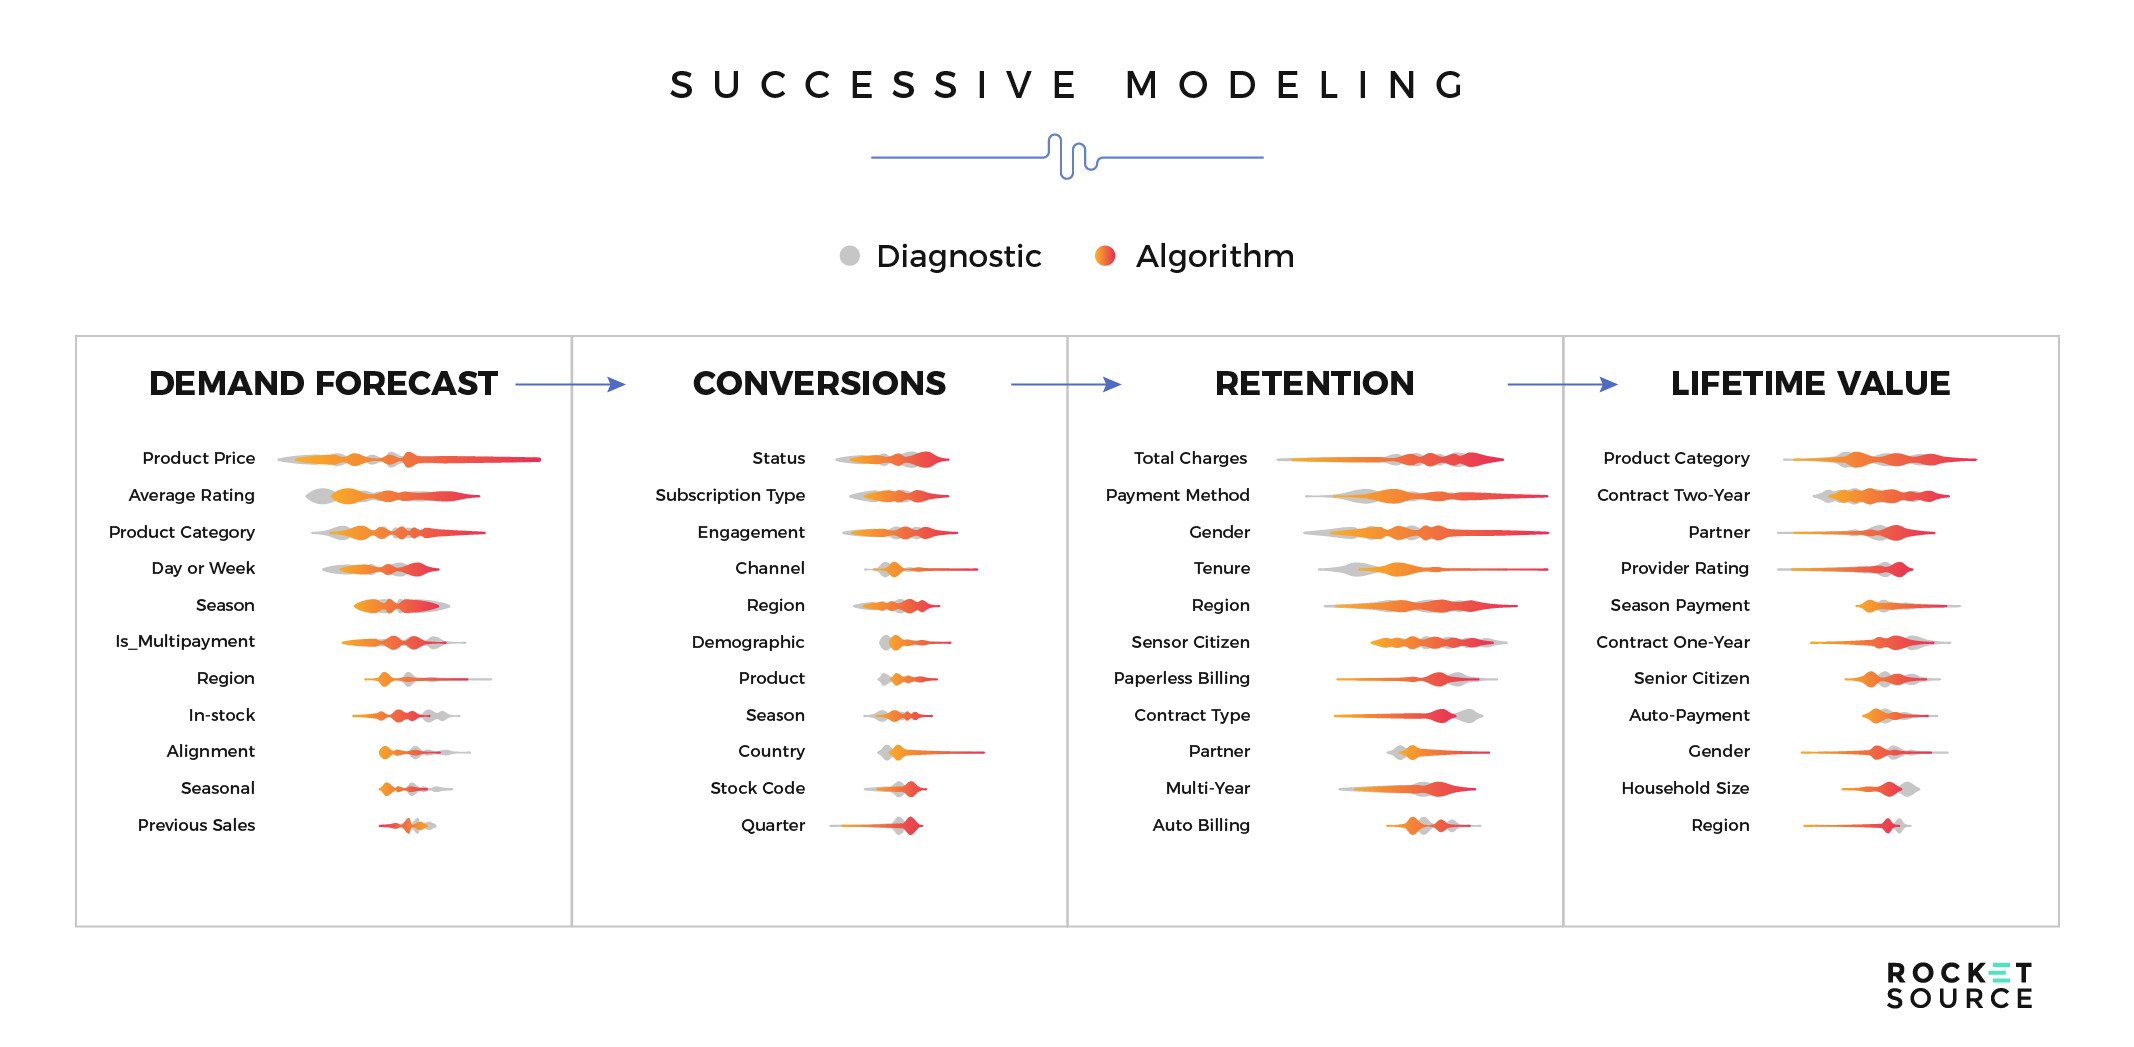
This is a basic example of what successive modeling looks like in action. We’ve kept it super simple on purpose to give you a high-level overview of what happens as you start to build this out. By tying in the purpose of the model, which in this case is to reduce churn, we can look specifically at the various feature sets in the model to determine which is most relevant. Here it would be the acquisition source of a given customer. Once we determine that feature ranks high in the variable importance chart, we naturally migrate toward that area of the business and, in some cases, develop a compelling enough case to build a subsequent model. In this case, it would be the lead qualification model. That process continues across various models used throughout the organization. Pretty soon, we have a model sequence that takes us from the start of the modern marketing funnel to the end.
As we progress along this path, we’re able to put guesswork aside. Instead, by leveraging the variable importance chart, we know with certainty we’re focused on the most critical areas of the business from an analytics and modeling perspective. With that in place, we’re able to build and operationalize an effective machine learning model for our specific goals.
The Span of Influence in Machine Learning Models
Your people influence the success of your machine learning models. There’s just no way around it. From the product and platform engineers tasked with setting up the infrastructure, to the data engineers and scientists who collect and model the data, and to the product manager officer (PMO) who instructs the direction of change, there’s a span of influence that extends across the strategic process. Here’s what it looks like:
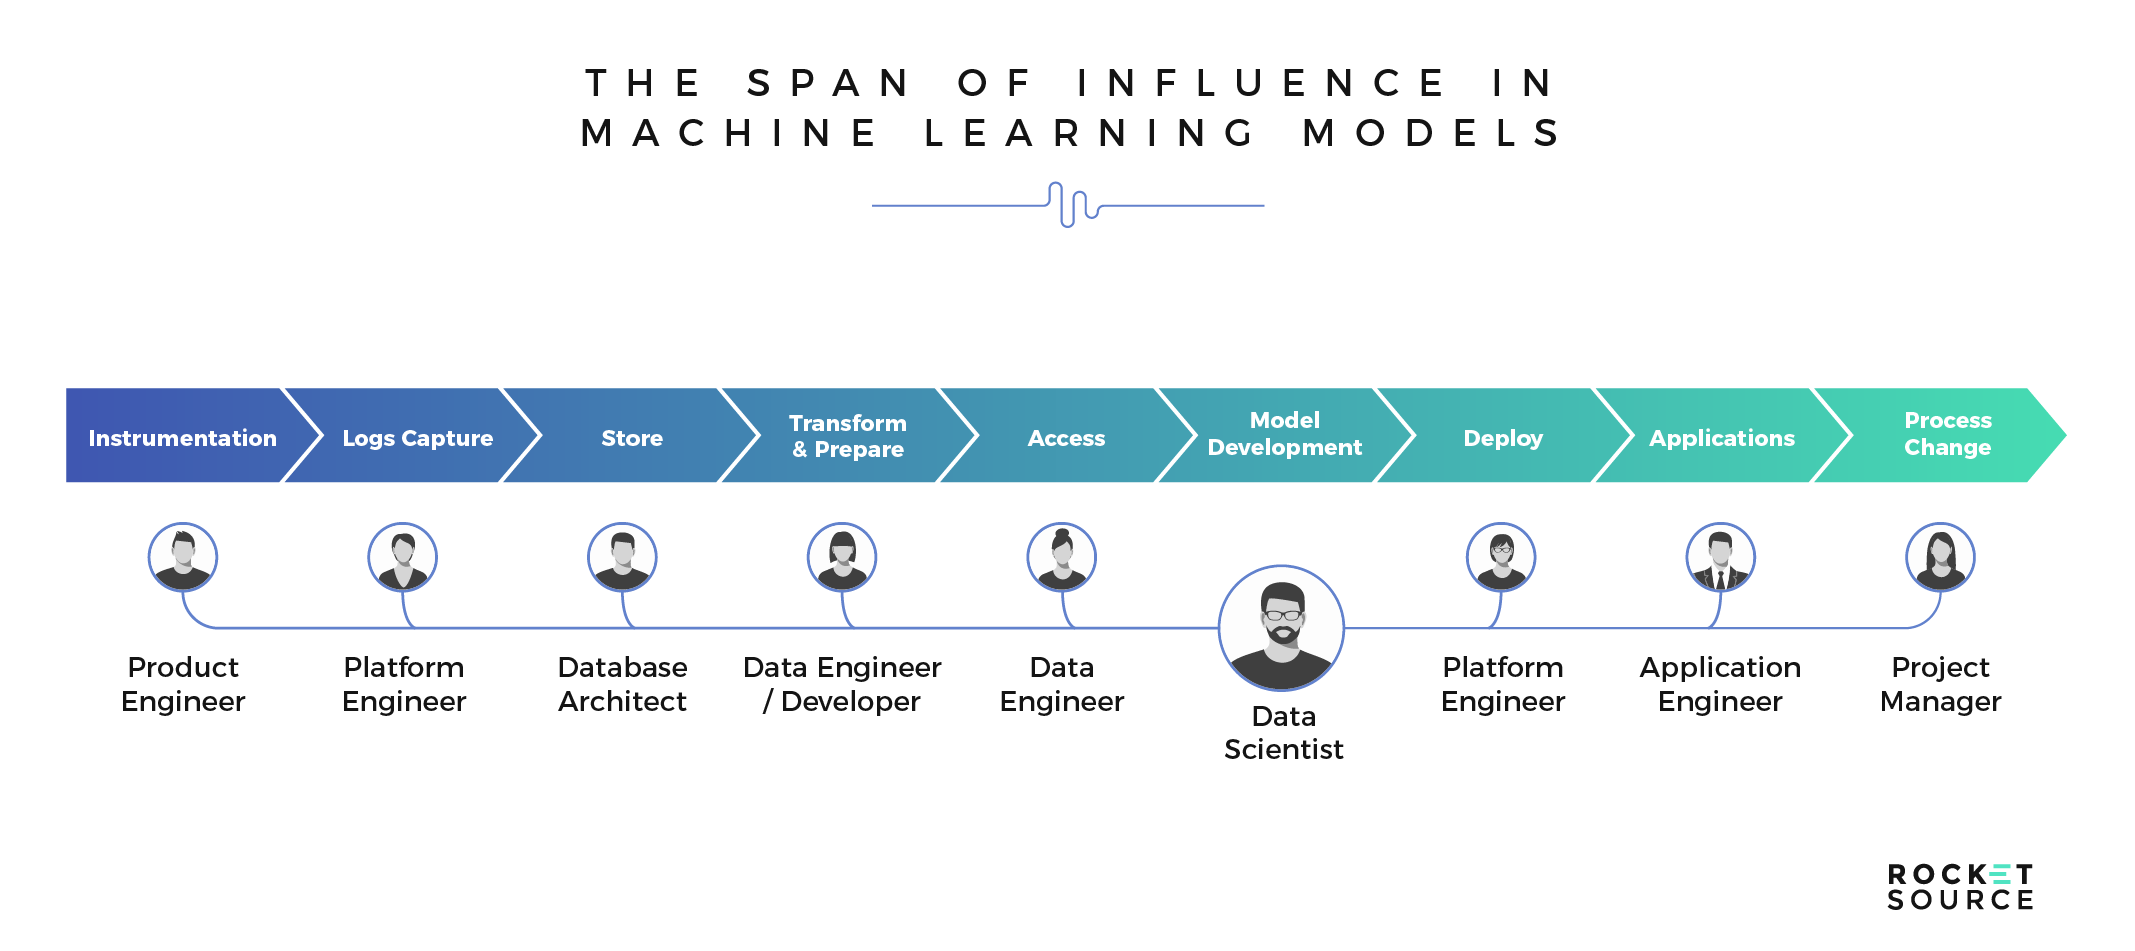
While each player here is an expert in his own right, he must know what the other influencers in the machine learning model need to succeed. You’ve likely heard us talk about the importance of V-Shaped Teams in the past when discussing the concept of skilling up your team members in areas outside of their immediate expertise. The same concept applies here. Peripheral skills matter a lot because your team cannot successfully build and leverage machine learning models if they’re working in silos. By having advanced communication processes in place to document conversations, outcomes, strategies and workflows, you’re able to operationalize the process of developing out these models.
Requisites for Operationalizing Your Machine Learning Models
As you can see, there’s a lot that goes in the backend of creating a machine learning predictive model, but all of these efforts are for naught if you don’t operationalize your model effectively with a proper amount of forethought and rigor. The scoping. The preparation. The building and inferring. Each of these is a crucial initial step of the overall model lifecycle. If you want your hard work to pay off, there’s no debate — you must drive the adoption and usage of your predictive model outputs. To do that, it’s imperative that you follow these critical steps.
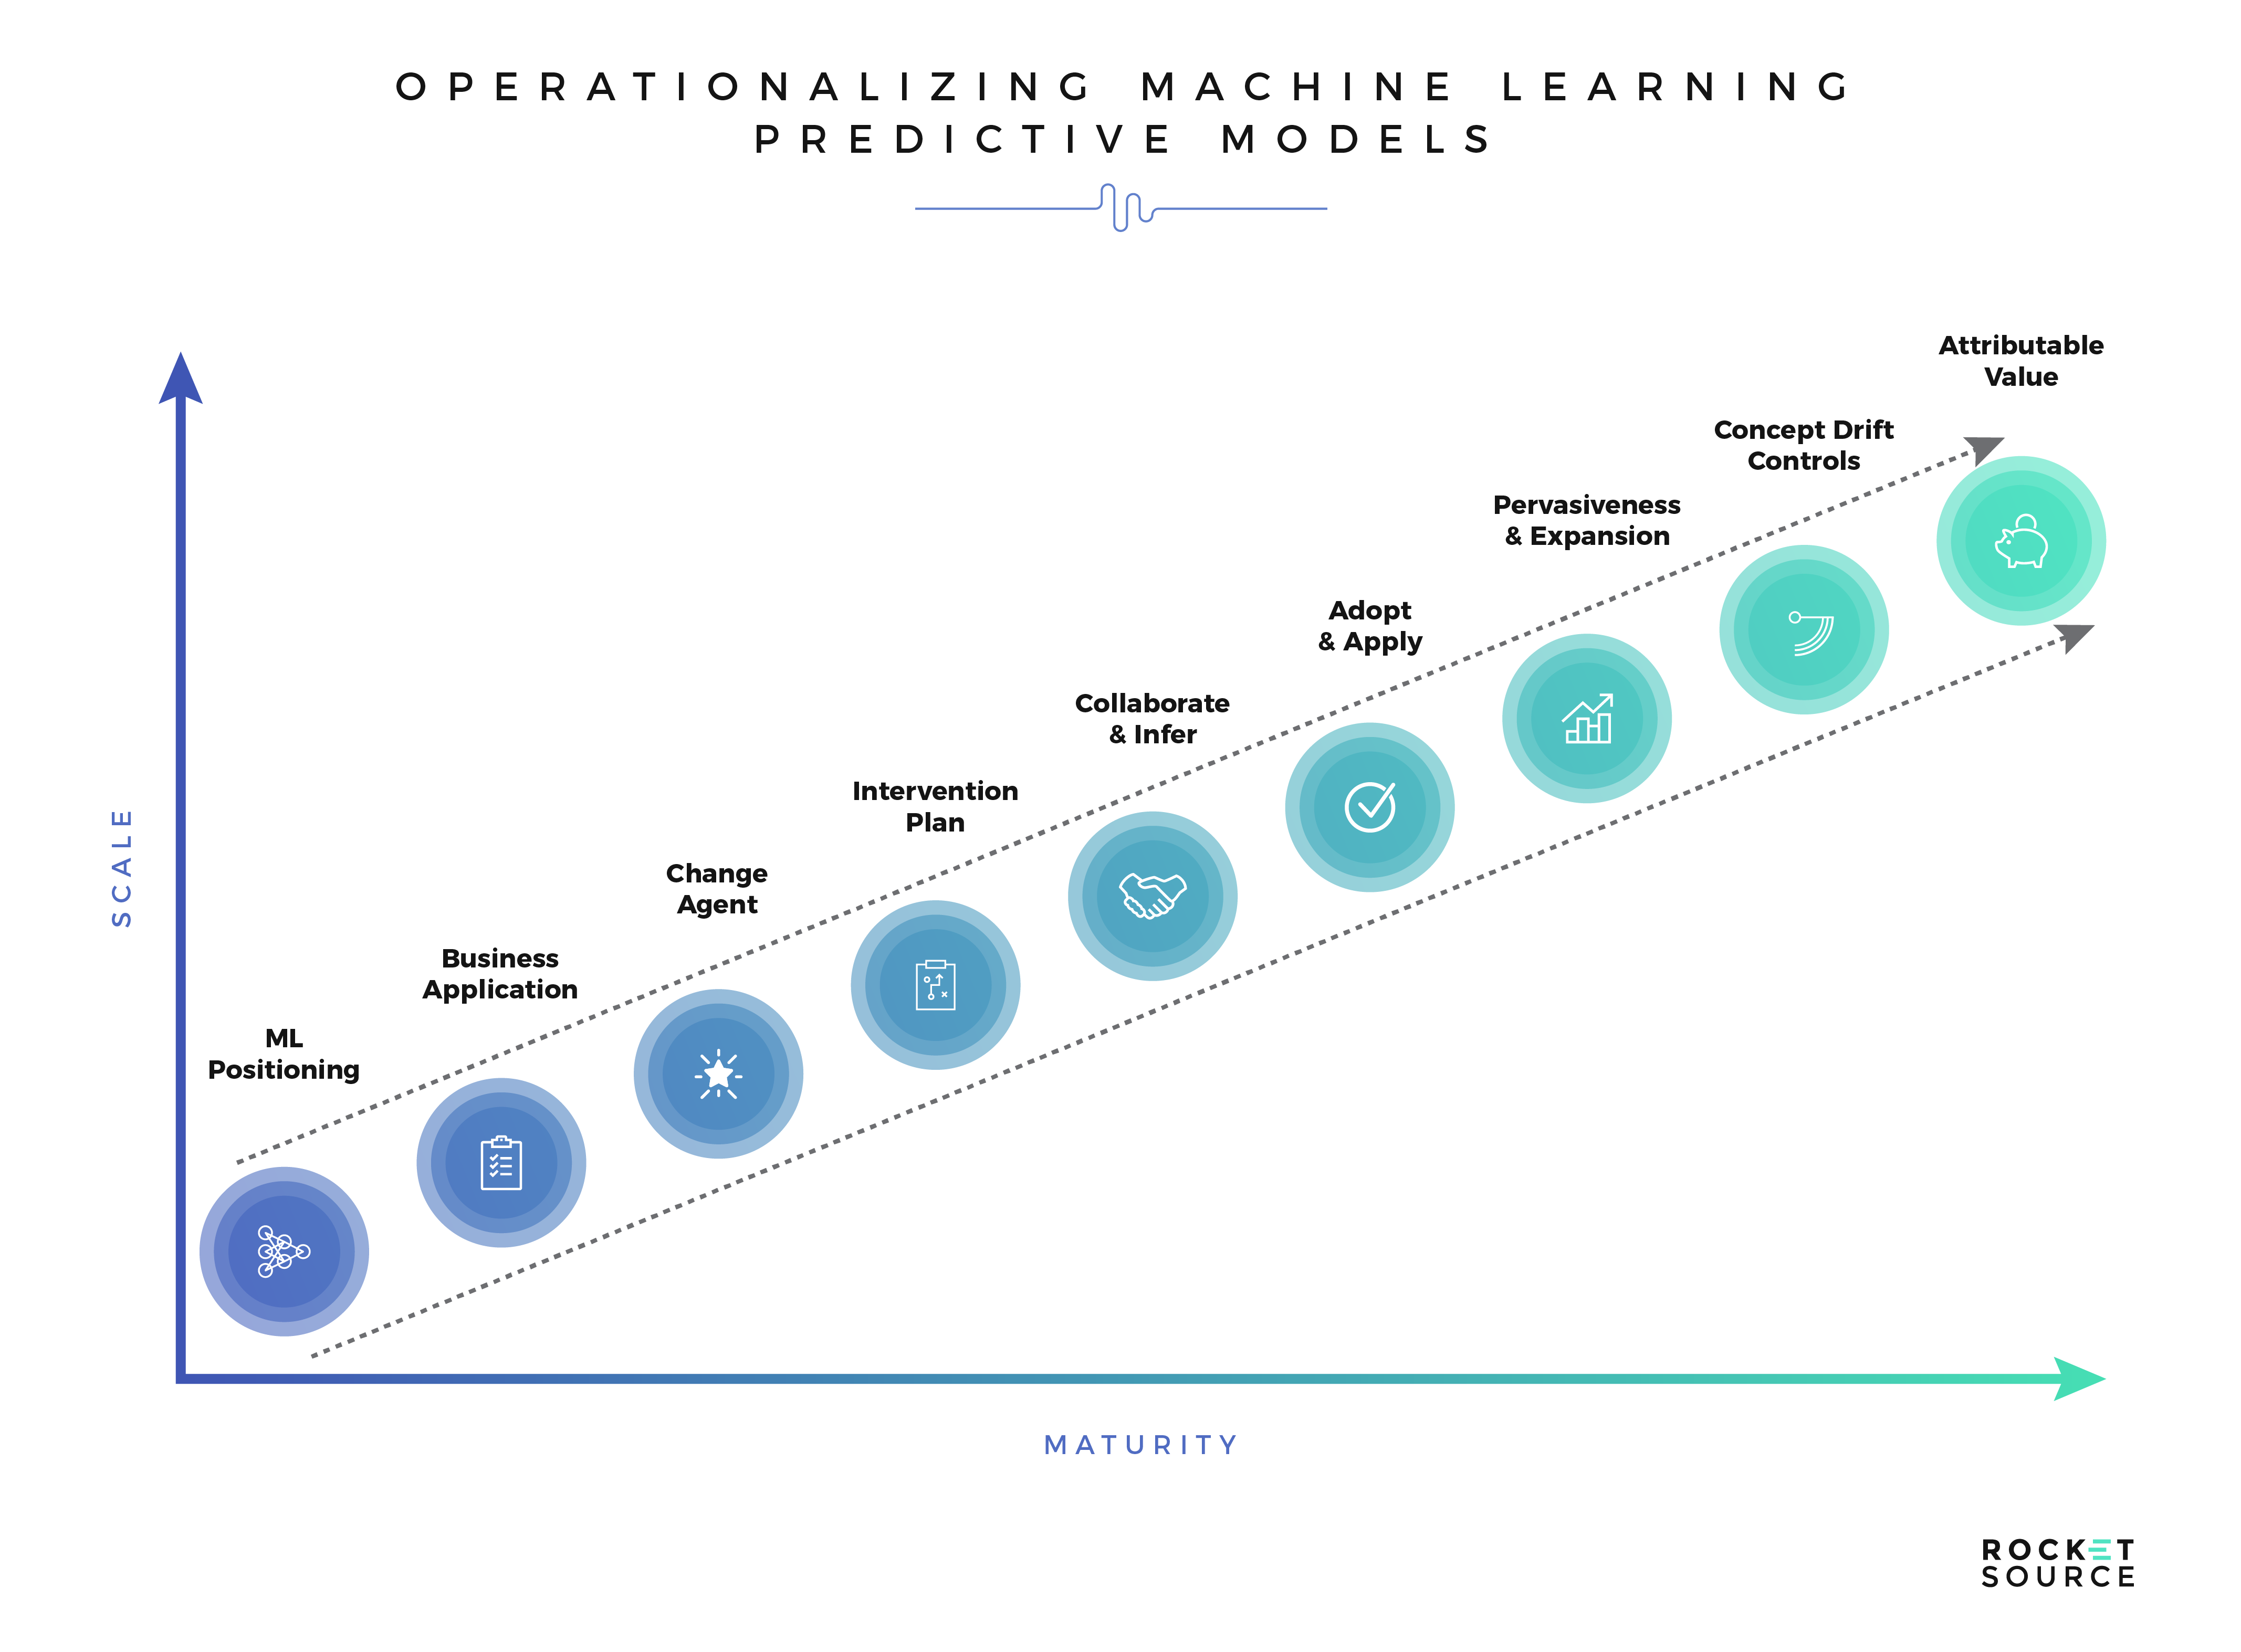
The ascent from low to high model maturity and scale starts with how you position your machine learning model. We already discussed this in detail earlier, so we’ll skim over it here. Your ability to properly position, or articulate and disseminate, the reasons for posing a problem or question in the first place, as well as the necessary steps to be taken are crucial if you want to drive full-scale adoption of a model. Once you have your team on board, you must also define the business application of the model itself. This application dictates whether the model will offer enough relevant value to the business to merit using the model in day-to-day interactions.
Scoring a given lead’s propensity to churn is a good example of the importance of defining the business application. If you’re able to provide a score to a business analyst or sales representative, that’s great, but that score alone might not provide a ton of value over the long haul. However, add to that lead score the context of what went into positioning and building the model, such as a basic, business-level inference of fit statistics (high recall performance vs. precision, etc.) and high-ranking action-oriented features (demographics, campaign, channel, source, etc.), and you’ll answer questions about how relevant the model is to the affected areas of the business. If, after following this step you’re still not sure, it’s time to scratch your head and wonder why the hell the model was built in the first place. On the other hand, if the model is applicable to critical business outcomes, this step you will help you uncover how to put your findings into motion, why the model is making the predictions it is and what you can do to improve.
Moving upward, every organization leveraging predictive analytics must come equipped with change agents in their back pocket. These agents, or forward-thinkers, act as the champions for your model. In the operationalization process, having them on board is critical to driving company-wide adoption of the model.
But, even with change agents on board, you’re bound to run into a roadblock or two along the way as a result of conflict, pushback, naysayers or apprehension. When a roadblock pops up, you need to be ready with a deployable intervention plan that includes putting your change agents to work advocating for the model with communication protocols to appease the imminent holdouts, naysayers and inevitable apprehension of the layman. Having leaders from your team (or from an external provider like, ahem, RocketSource) on board with the model can help you explain what’s happened by answering questions around specific fit statistics or drawing correlations to the business model. When change agents are armed with documentation, protocols and forethought, deploying an intervention plan is faster, easier and more effective over the long run.
Onward, again! And this is where things get exciting. As company adoption continues, your team is able to collaborate and infer based on the model’s findings to ensure that key players and stakeholders are on the same page, working together to champion to the broader team the work that needs to be done. This task cannot happen haphazardly. It must be purposeful to properly educate the model’s users and consumers. A few months back, we wrote an entire article on organizational growth that highlighted the importance of information dissemination and combinatory systems and that applies heavily here. When done with intent, this high-level collaboration drives adoption and application of the models. Through this approach, companies can assimilate the outcomes of the models into the critical processes of an organization at both macro and micro levels. This is where the rubber meets the proverbial road because you’re inspiring growth in an organic fashion instead of by asking people to take action without understanding how it pertains to them.
As the outputs spread to impact all areas of the organization, you’ll soon reach the point of pervasiveness and expansion. It’s at this point you’re seeing the models driving attributable value. And although we’ve made it seem like a simple upward progression to this point, make no mistake:
Realizing the true ROI of a model is difficult to achieve, simply because it can happen in a multitude of ways.
For example, you can use a predictive model to calculate how much money the customers you kept from churning are worth to your company. That part is easy. Calculating the bump in conversions you got as a result of more sophisticated targeting and going after specific leads is a little more difficult to correlate from a value perspective. Although difficult to reach, this pinnacle isn’t out of the question, but getting there requires you to have a successful deployment of your machine learning models.
The 4 Machine Learning Models You Should Be Using
We’ve covered a lot in terms of what goes into machine learning models. Although there’s a lot to the setup of these models, the key to building a model that works has very little to do with the technicalities. Instead, it has everything to do with knowing what you want the model to solve. You read that right. It starts with asking the right questions straight out of the gate. In fact, even more so, success is about asking the most elegant of questions.
At this stage of the post, instead of going deep into the models themselves, we’re only going to cover the basic building blocks. The reason is simple. Every business is different. Every company has a different dynamic between their 3Ps and each application of data looping, AI, machine learning and deep learning is based upon the qualifying data sets/loops needed in order to extract the most important insights. So to that end, we are going to oversimplify the complex so that you can get a good grounding regarding where in your company’s lifecycle you might start asking the right kind of questions.
What Do You Want Out of Your Machine Learning Models?
Knowing what to ask is tantamount to whether you’ll have success in any predictive initiative. One question businesses typically ask of customers is, “what do you want?” When a respondent answers, the goal is to then back that answer up and check for a correlation with another element, such as the amount of time it took them to commit, how long they committed to the company, their propensity to churn, etc. While the question around what a customer wants might be common, it’s possibly the wrong question to ask because it’s only focused on one thing — the outcome.
Outcome-focused questions do not serve as a good starting point for many conversations. This point is especially true regarding conversations about the type of machine learning models your organization should be using. If you start with the end in mind, believe us, you’ll bring so much cognitive bias to the table that the outcome will have a limited effect. Instead, the right question to start with is based upon the intrinsic workings of the StoryVesting business transformation framework and is more akin to the heart of the customer and employee experience — the drivers of “WHY” they do business with your brand. Why they choose your product or service over your competitors. Why they believe in your Story (remember this is not about fictional stories, this is about why your company exists). Why they are Vested in your brand experience.
Here’s what that looks like in practice:
- Asking detailed cohort-specific questions about how a customer thinks, feels, says and experiences about your brand experience and why
- Asking detailed cohort-specific questions about why the customer would NOT consider your brand or your product/service and why
- Asking employees questions related to the core Brand Why or Story
- Asking employees questions related to the bridge between the Brand/Employee/Customer Vesting triggers
In asking these questions, you’re giving more depth to the data scientist regarding what needs to be solved. With that information in mind, models can be formed to answer the right question and come up with effective solutions.
In reality, the questions above are just the primer to discovering behavioral drivers…drivers rooted in cognitive and emotive biases that have to be assimilated into any model. And as easy as this sounds, believe us when we tell you that this part of the data looping process is not only the most important but also the most difficult aspect of bringing a successful advanced analytics initiative to your organization.
Considering the Bow Tie Funnel While Building Machine Learning Models
Equally important to asking your customers the right questions is understanding where your buyer is in the bow tie funnel — or across their entire pre-purchase and post-purchase journey — and uncovering how vested (emotionally and cognitively) they are at each stage and why. If you haven’t taken any measures to map out your customer experience yet, we can confidently say you’re missing out on a massive opportunity, and we’d be very happy to help you see how intelligent mapping is done versus the plethora of oversimplified journey modeling tactics.
The driving force in business transformation, specifically digital transformation aided by machine learning models, rests firmly on the amplitude of your customer experience strategy across the bow tie funnel.
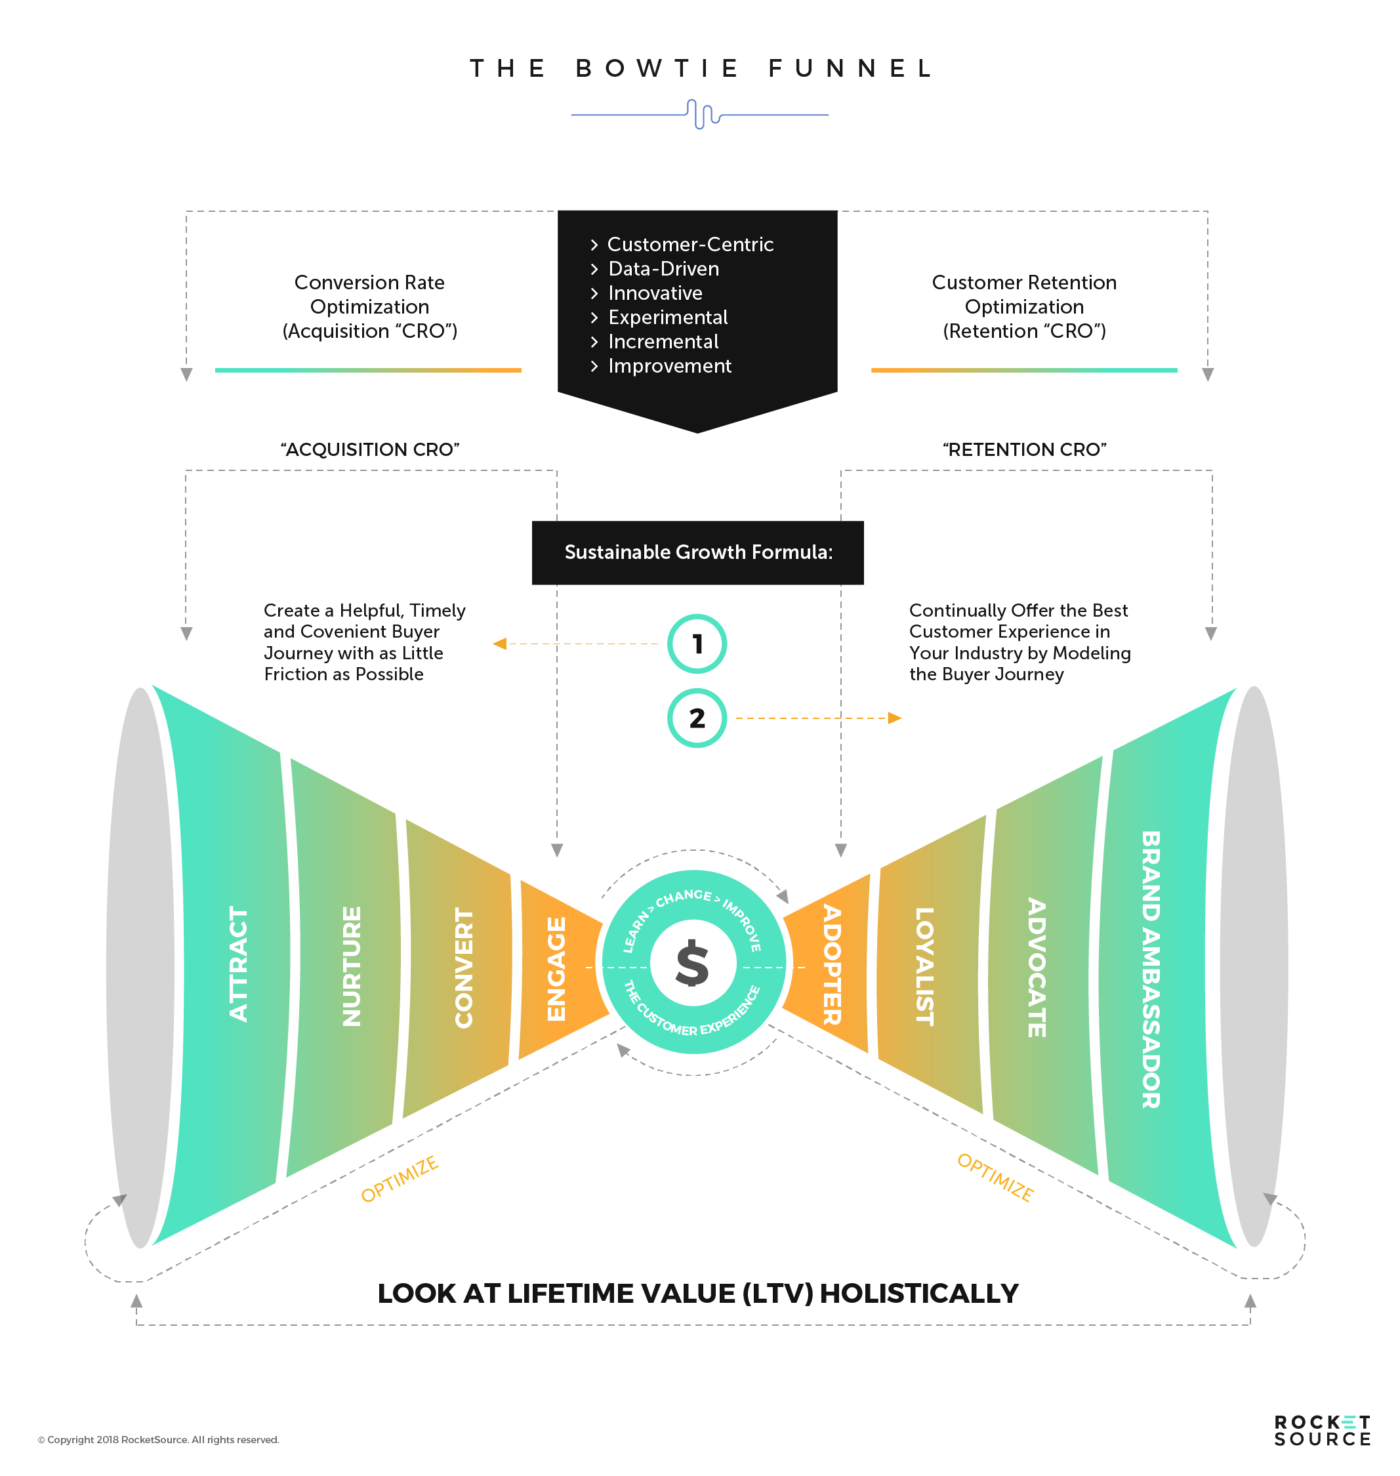
We’ve covered the bow tie funnel in-depth in the past, including in our posts about customer journey mapping, the business transformation framework, StoryVesting and also while analyzing the customer journey funnel. We aren’t going to tear it apart again here, but we bring it up now to offer a lens through which to approach your strategy.
Organizations can benefit from having machine learning models in place to run predictive analytics across all stages of the bow tie funnel. At the top of the funnel, you’re looking at how to convert your customers. In the middle, you’re aiming for retention. Across the board, you’re hoping to learn how to improve the lifetime value (LTV) of your customer while providing an exceptional employee experience that keeps your team on board and engaged. Let’s dig into each of these models in more detail.
1. Lead/Opportunity/Conversions Model
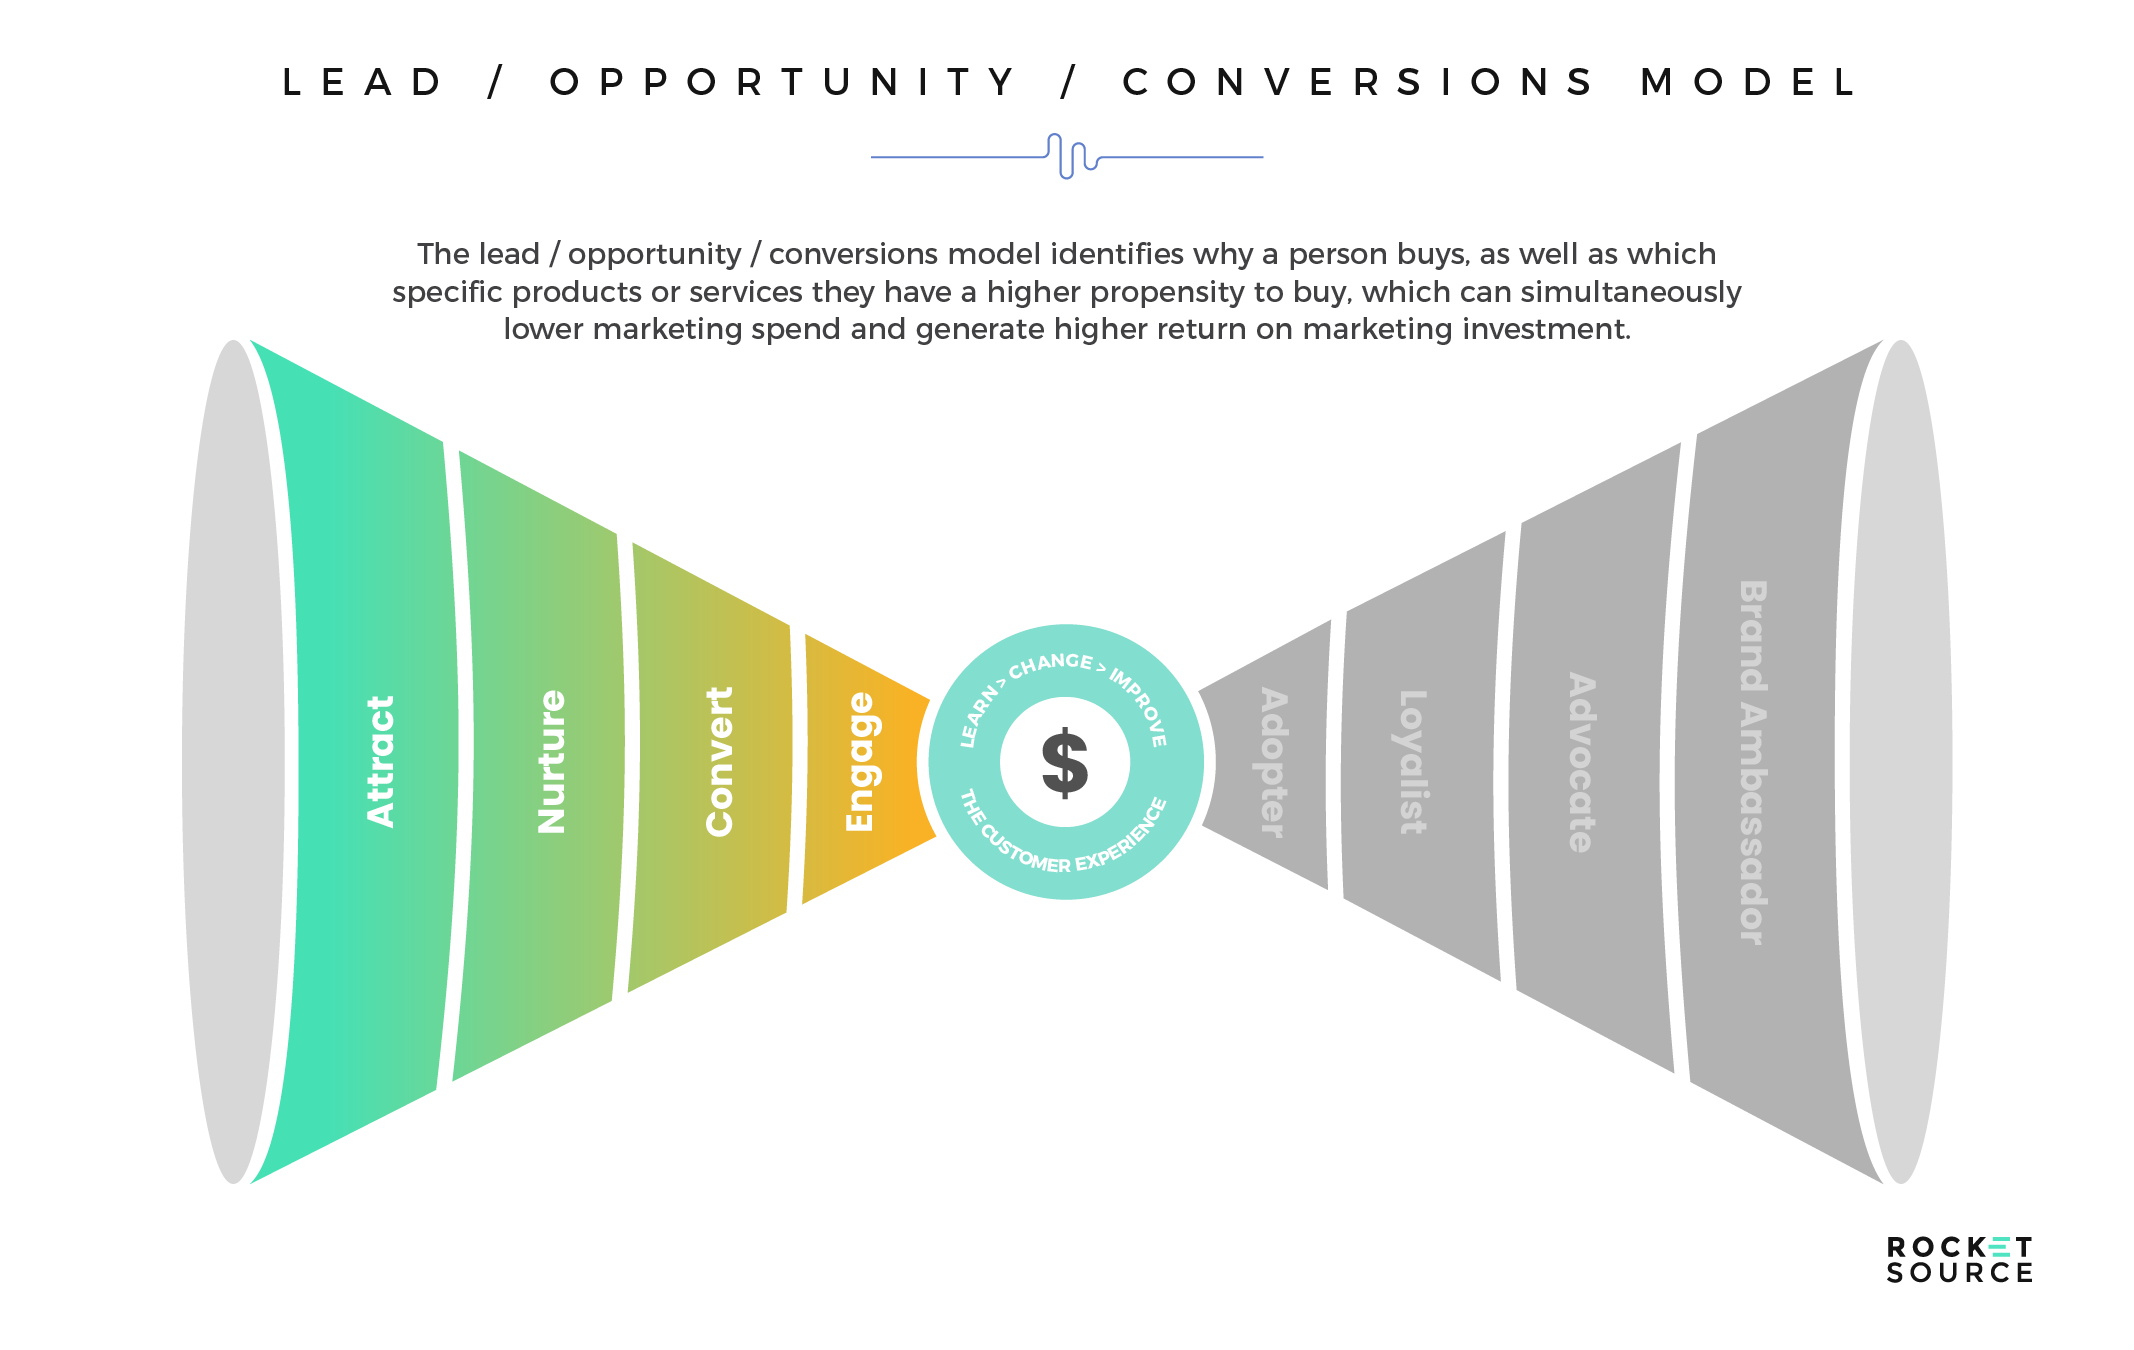
The first of the four types of models focuses on the first half of the bow tie funnel — specifically, on getting people to the engagement phase where they’re excited to buy from you.
This model is critical because it helps identify the emotional and logical triggers of customers who have a higher propensity to buy. These insights fuel a strategy to develop more personalized marketing — something consumers are so hungry for they’re willing to hand over their data in exchange for more personalized messages. In fact, over 50% of customers want personalized offers and recommendations specific to their needs. To deliver these personalized offers requires putting available data into a lead/opportunity conversion model to predict exactly what the buyer needs to hear and when they need to hear it. Being able to predict those moments of truth when a decision is made means companies can ensure they show up at the right time with the right message while delivering a more personalized experience along the way. It’s less about gut instinct and more about precision messaging.
One industry that’s particularly prone to this need for personalization is the nonprofit industry. Over 75% of charitable donations in the United States come from private donors. When you consider that roughly 90% of all donated money comes from just 10% of donors, the importance of reaching every single consistent donor really hits home. Identifying more potential donors could entirely change the donor engagement game. Asking the right questions is critical for designing a machine learning model capable of accurately predicting who has the highest propensity to donate. That starts with knowing why people donate and identifying who has the features and attributes of those who have a higher propensity to donate. Then you can target those people.
Understanding the layers of “why” behind a donation is critical, especially because donor loyalty is primarily driven by an emotional and personal response to the cause. According to a Donor Loyalty Study by Abila, donors typically participate in charitable giving for three reasons:
- They have a deep passion for the cause
- They believe the organization depends on their donation
- They know someone affected by the nonprofit’s mission
This type of data extends far beyond the confines of basic demographics available from the United States census, relying instead on a deeper understanding of what’s happening in the donor’s world that would make them more likely to contribute to a charitable cause. Some of the most important variables to consider include:
- Past donations
- Areas impacted by the donation
- Relationship to current donors
By analyzing these basic variables, you’re able to get more context around the behaviors of your potential donors, making it easier to understand which emotional and logical triggers you need to tug on to increase their propensity to donate. It helps to personalize the messaging you use to reach the donors, identify the most relevant triggers to those potential donors, hone in on the ideal timing to reach out, and more. It also helps to ensure you’re spending your limited marketing budget on reaching out to the people with the highest likelihood of donating. Without knowing the why behind a donor’s drive to contribute to a charitable organization, data scientists might steer the model based on descriptive data, such as household income, gender, marital status, career and more. These basic demographics don’t always have a strong correlation to whether someone will donate, making it hard to accurately predict who has the highest propensity to donate.
By taking a more empathetic stance with the donor, machine learning models can be coded accurately to avoid unintentional and unrelated bias while driving stronger results. External-facing efforts aren’t the only places these models hold value. In any industry, not just with nonprofits, the empathetic stance this model requires can help once a customer or donor has already taken action with your organization and moved further through the bow tie funnel.
2. Attrition/Customer Retention Model
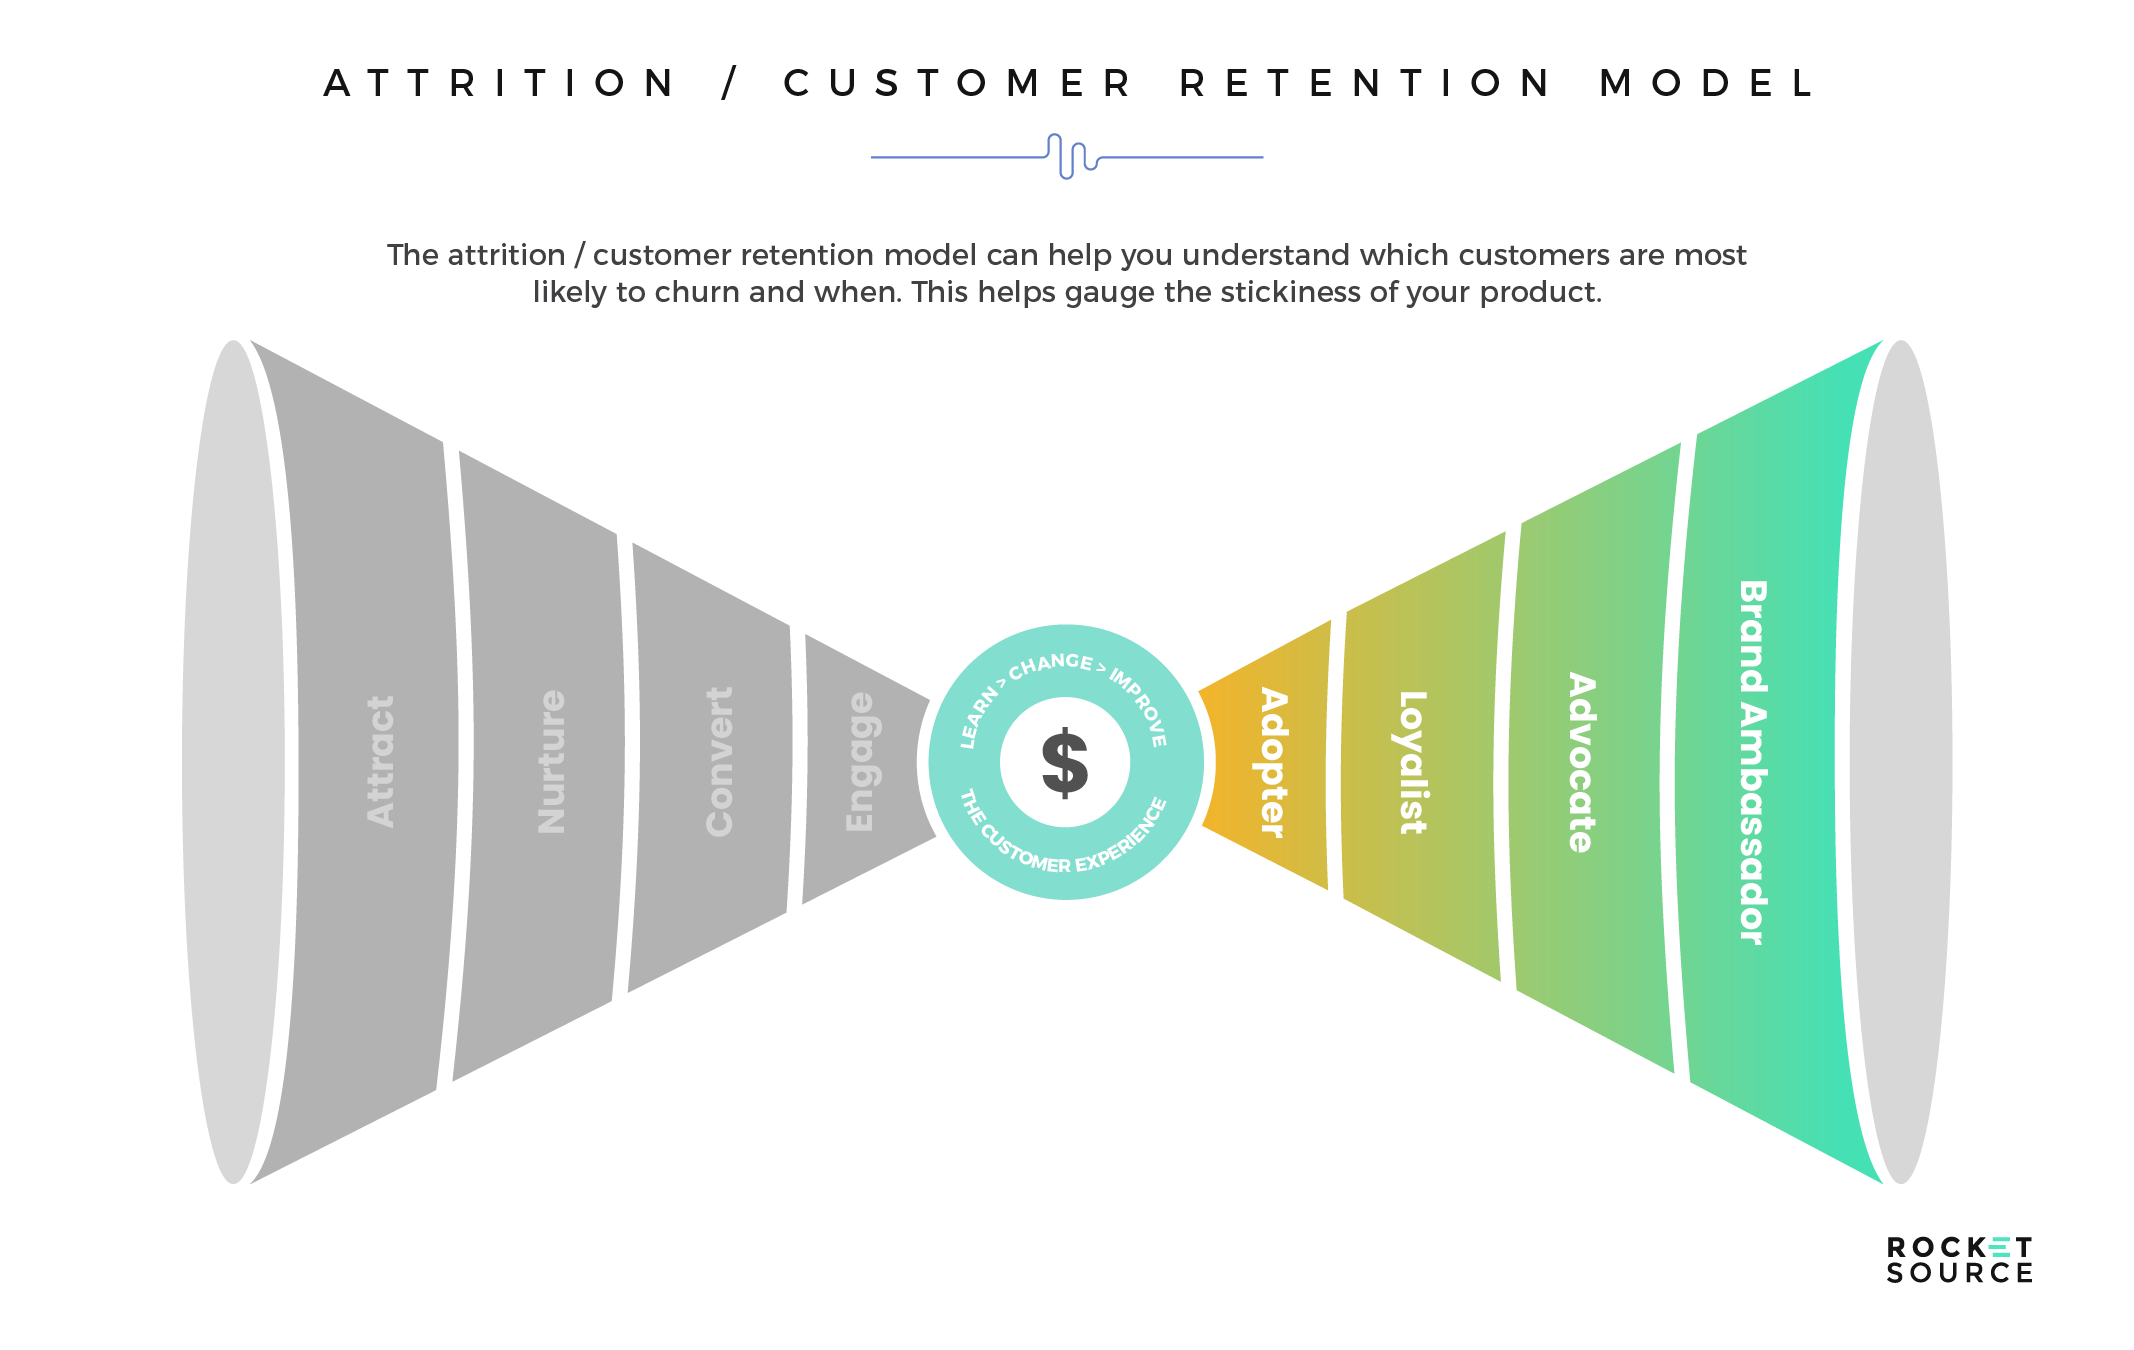
The speed at which the current market is evolving should be enough to make any watchful CEO a little clammy under the arms. There’s more need than ever to properly manage your customer base. That’s because customers today have many innovative options at their disposal. By leveraging analytics and machine learning models, you’re able to understand a buyer’s propensity to churn as new competitors arrive on the scene and proactively work to keep buyers in your court. The opposite holds true as well when we look at innovating on predicting retention.
We’ve seen the impact lower attrition can have on an organization first-hand while working with many companies who excel in retaining customers. In fact, one of our clients boasts a customer retention rate of over 90%, which is almost unheard of in most industries. In analyzing what this company, and many others who dominate their industry, look at regularly, we whittled it down to three core elements that make a customer retention model more impactful — gaining a 360-degree view of your customer to better understand their cognitive associations with your brand, maintaining a long-term point of view and taking an agile stance.
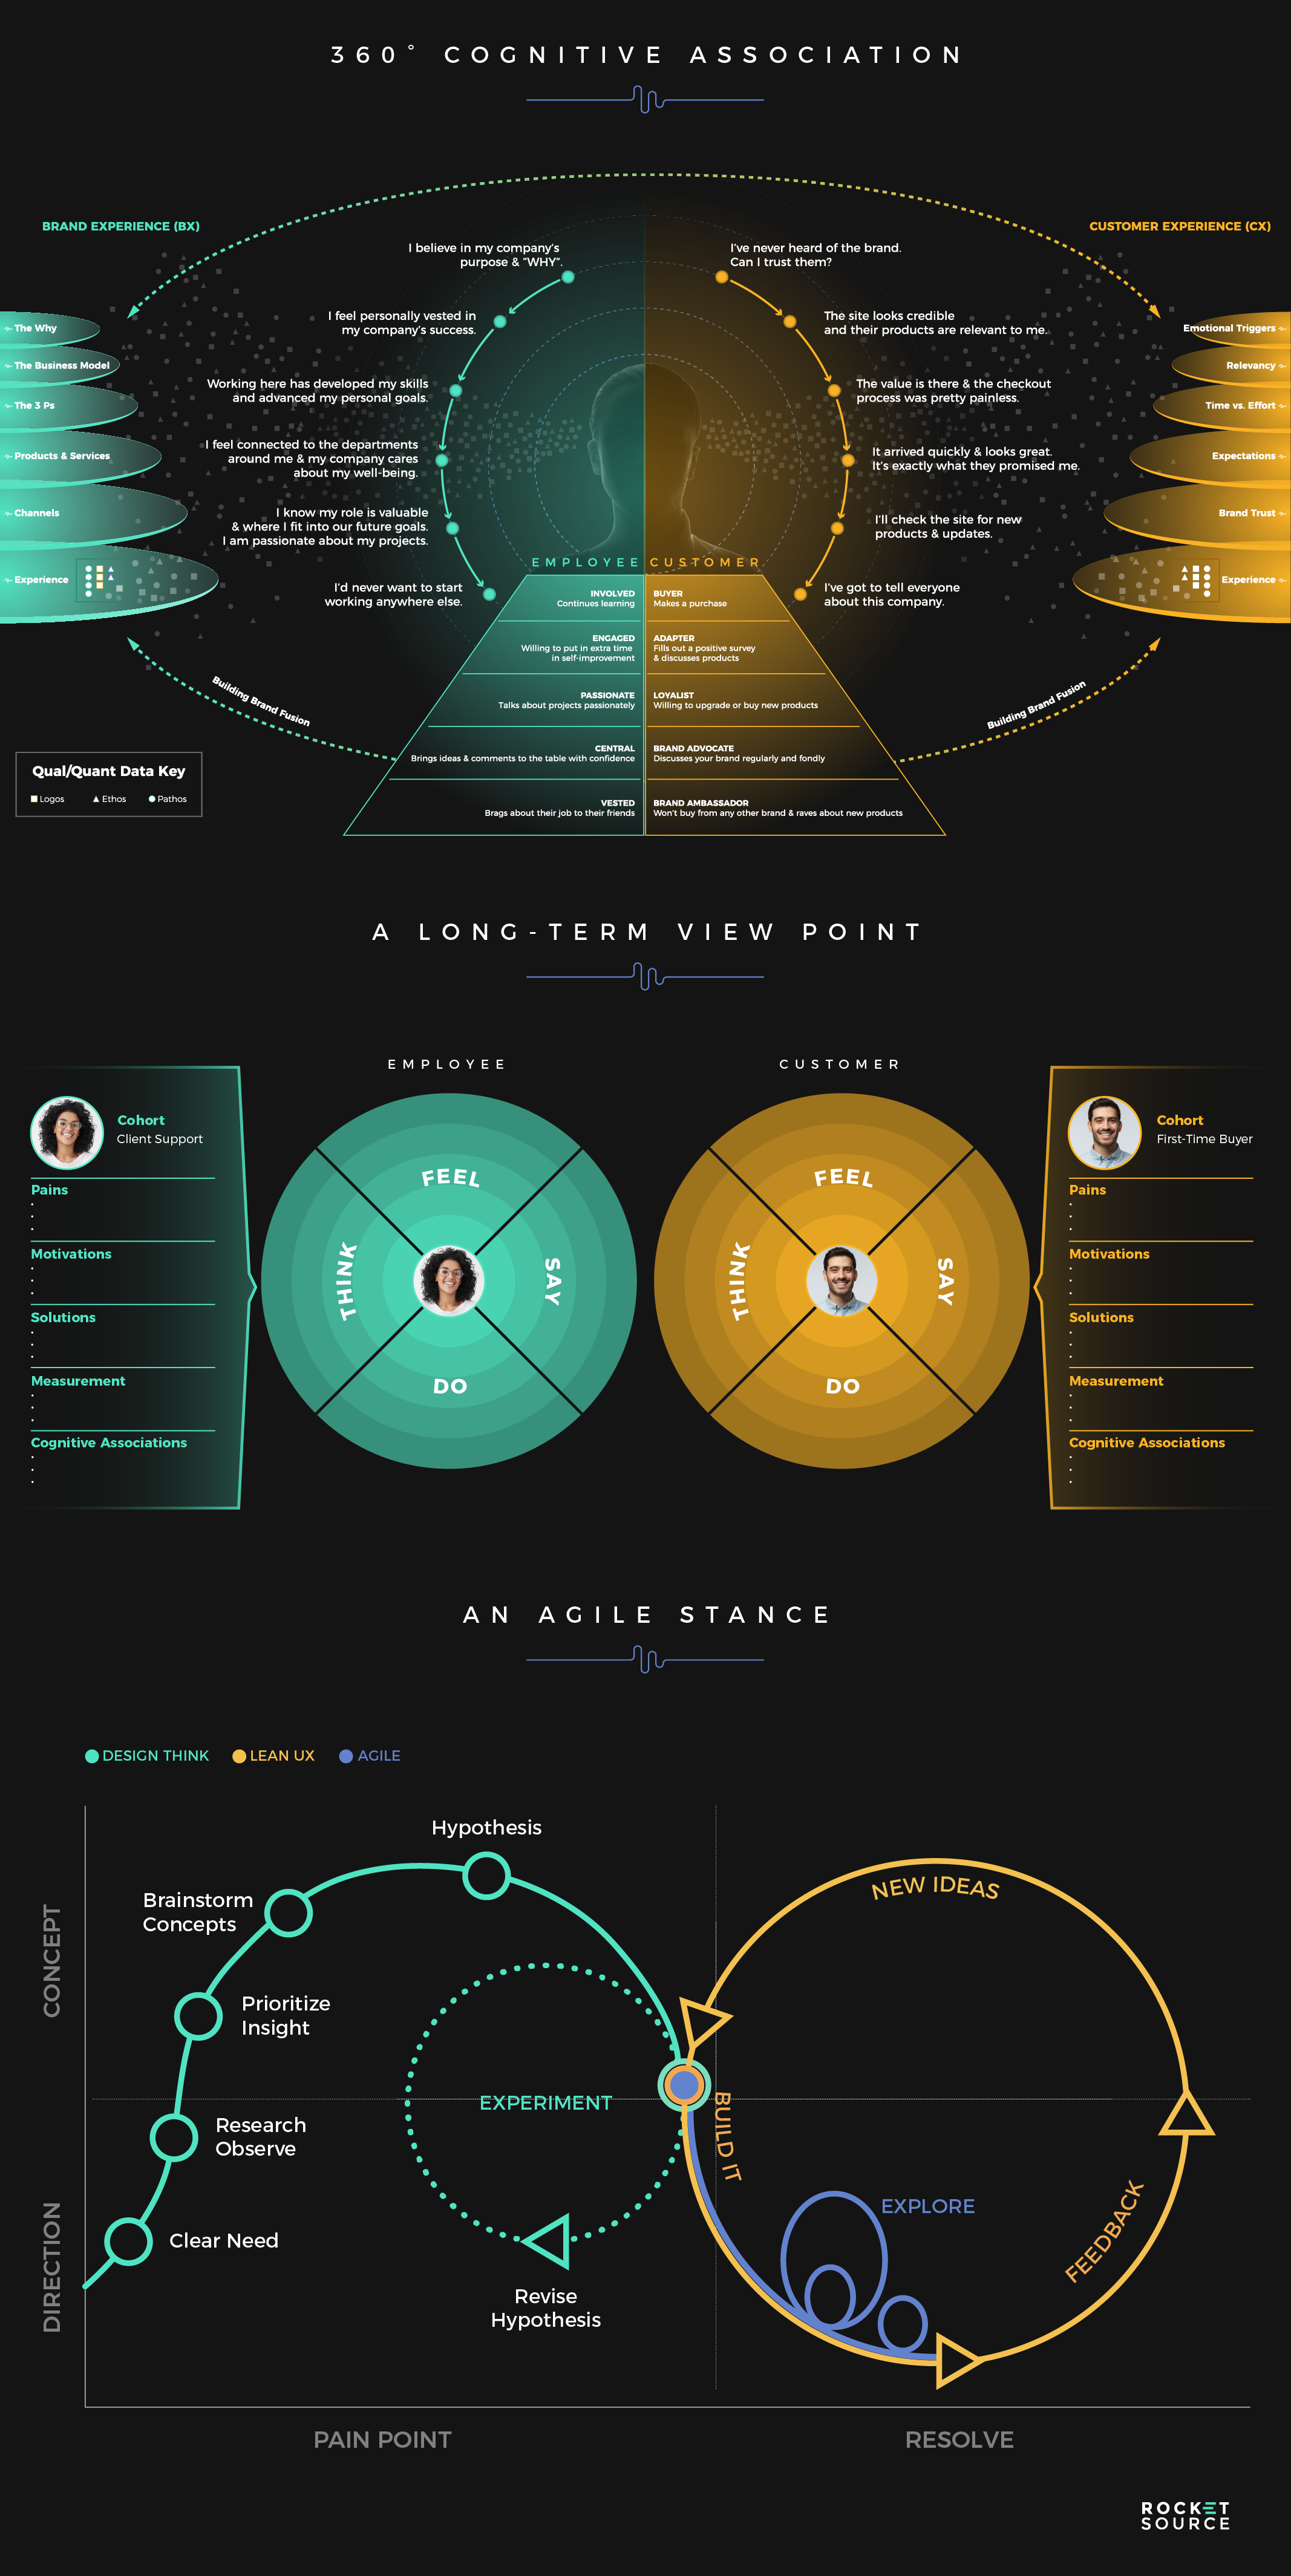
The first place to start is by gaining a 360-degree empathetic view of your customers. Obtaining data that spans the bow tie funnel, gives you the full picture about what’s happening in your buyer’s life. Instead of looking at singular touchpoints, you’re able to get a better idea of the end-to-end journey your buyer takes, which helps you understand how your organization can better swoop in to meet their needs at every phase. This understanding is absolutely necessary before trying to develop a model or analyze behaviors.
A 360-degree empathetic view doesn’t stop with analyzing touchpoints, though. To ingrain this level of empathy in your organization, it’s critical that you put yourselves in your buyer’s shoes. One marketing team at a wig company did this years ago. Instead of imagining what it’d be like to be forced to shave your head after getting a cancer diagnosis, they decided to get as close to their customer’s pain points by shaving their own heads. It was only by going to this extent that they were able to truly understand the dramatic emotional and physical changes their customers experienced. Regardless of how you put yourself in your buyer’s shoes, it’s critical that you put in the hard work of being empathetic.
Teams are better equipped to leverage brilliant and effective machine learning models when they do the hard work of empathizing with their customers.
Once your team has an ingrained empathetic mindset, you can begin to take a long-term viewpoint to use machine learning models to predict what your buyers need to keep them progressing through the bow tie funnel ultimately becoming brand ambassadors. This requires you to look well beyond retention alone and leverage feature discovery techniques to identify multiple variables and thresholds that could impact a person’s decision to stay with a business or move to a competitor. Getting to the root cause of discontent lets organizations improve the experience long before it drops to the point that a customer considers leaving.
Because we live in a world where new opportunities are presented almost daily, in order to consistently grow you need a machine learning model with an agile stance working in real-time to identify a customer’s propensity to churn. This consistent approach requires you to operate on agile — a strategy and tactic that might be different from how you’re doing business today.
Operating on agile is a tactic that lets you quickly test, measure and test again to see which practices work to lower attrition and which have a direct impact on the organization’s bottom line. The more you test and the more quickly you get the results, the better you’re able to adjust your strategies and operations to answer the customer’s needs. To understand what this looks like, let’s look at an example of a company that identified the customers with the highest propensity to churn and took proactive steps to keep their customers and profit — Triangle Pest Control.
Triangle Pest Control wasn’t failing, yet the owner was concerned by their high attrition rate. CEO Jesse Rehm determined that the company was meeting expectations — and that was the problem. They were doing everything the customer expected of them, but nothing more. This meant that as soon as a better offer or a better experience came along, the customer would switch—they had no compelling reason to stick around. The customers with the highest propensity to churn were those in their first year of a recurring pest control account. On the flipside, the customers with the lowest propensity to churn were those with hybrid services.
Triangle Pest Control came to the conclusion that they had more to offer, and would need more to keep people coming back, so they took an empathetic stance to make their customers’ experience more exceptional. In the process, the company realized a few things:
- They acknowledged their customers’ “insect fatigue” — they were seeing enough pests already, so they didn’t need to see another one in the business logo. This prompted a series of strategic logo redesigns.
- They recognized the personal nature of letting someone into their home to spray for pests and compensated by making strategic shifts in messaging and employee behavior.
After looking more closely at the propensity to churn in the first year, and at which months had the highest rate of departure, they realized that they needed to do something to wow customers around the seventh month of their contract. So, in the seventh month, they called customers out of the blue and offered a discount on the next month’s service. In the eleventh month, they offered a free add-on.
In addition, the company knew how intimate pest control could feel because their customers were welcoming them into their home, so they trained their staff to treat those opened doors with respect. They encouraged them to go above-and-beyond the call of duty by bringing in empty trash cans from the curb, picking up the customer’s newspaper and more. These offerings were just what customers needed to be reassured that they mattered to the company — and all these efforts paid off.
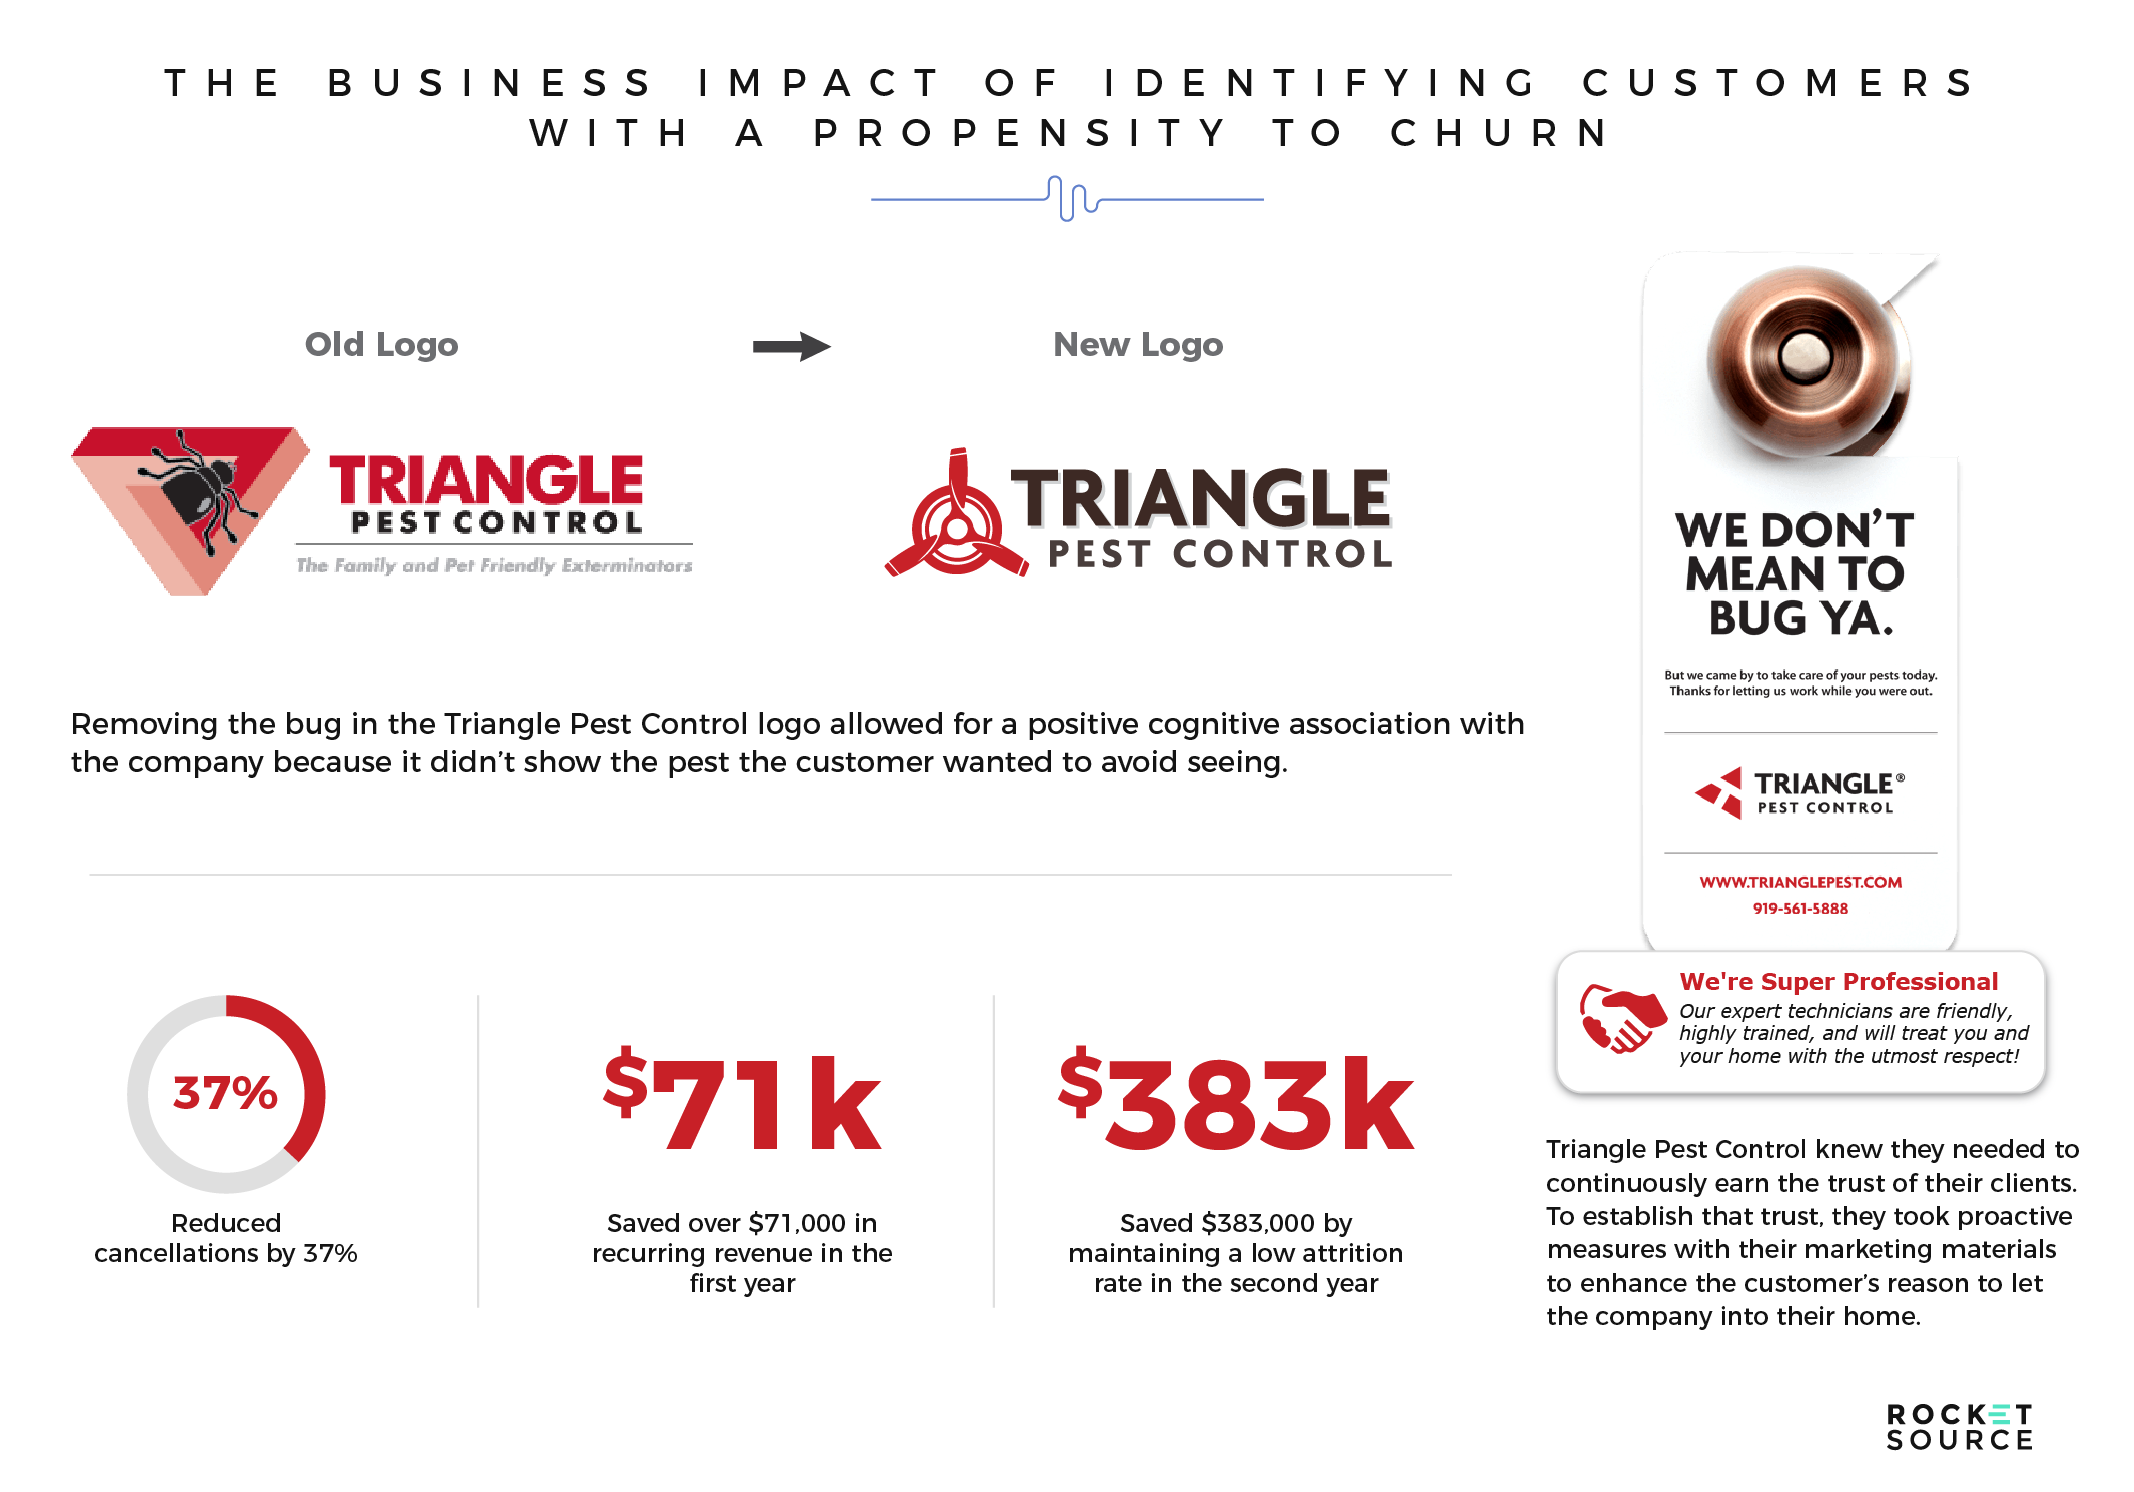
In just one year, by identifying and nurturing the customers with the highest propensity to churn, Triangle Pest Control reduced cancellations by 37% and saved over $71,000 in recurring revenue. In the second year, they saved $383,000 by maintaining the low attrition rate.
Over time, the reasons customers leave will likely change as more innovations and competitors hit the market. Having a machine learning model in place to identify customers with high propensity to churn, the reasons for customer churn, and the months when they’re most likely to leave helps organizations put the right resources in place to lower attrition rates while reducing costs. That starts by having a 360-degree view of the customer, taking an empathetic stance and running an agile operation to adapt to consumer needs. Ultimately, these efforts can lead to higher customer lifetime value. But, in order to ensure that LTV increases, many companies run a separate lifetime value machine learning model to dig deeper into what it takes to keep customers wanting to deepen their relationship with the business.
3. Lifetime Value Model
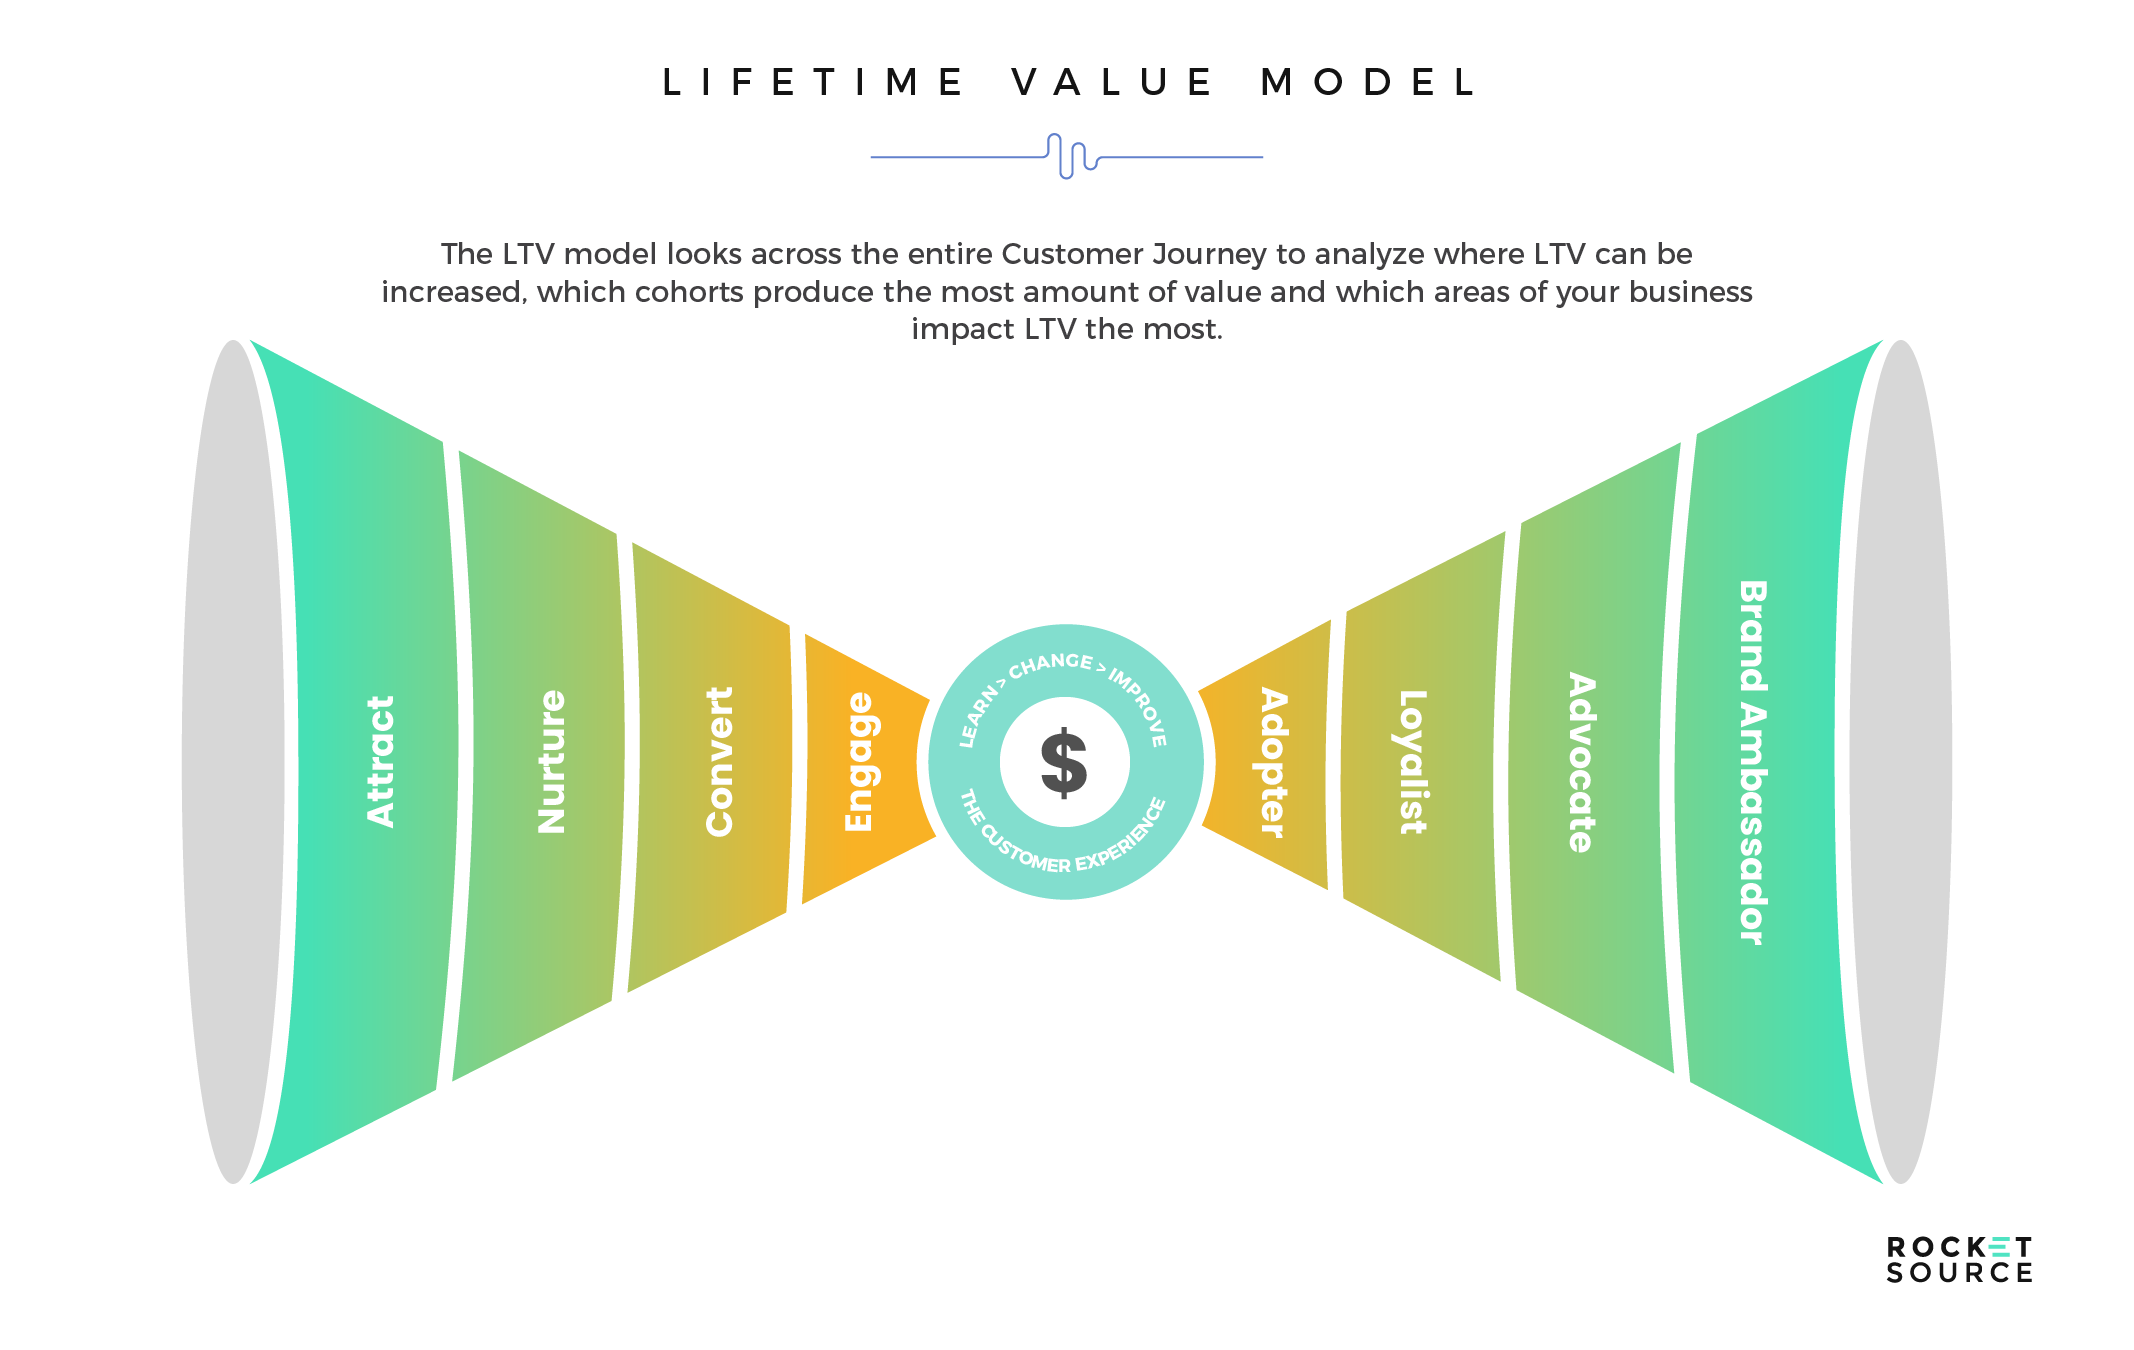
In our LevelNext MasterClass Workshops we teach the importance of gathering intelligent data around customer and employee experiences and then mapping that data into data visuals like radar graphs and innovation and idea matrices. Few organizations go through the necessary steps to gather the data needed for these types of insights which, if you ask us, is a missed opportunity. In fact, we believe so strongly in this approach that we’re deploying it in one of our RocketSource Labs concepts today. By mapping quantitative and qualitative data after conducting shoulder-to-shoulder interviews of potential product users, we’ve been able to shift how we’ve built out our product even before applying any model whatsoever. More on that to come, so stay tuned! For now, let’s look at another example of how this plays out in the real world.
Consider a recent trip we took to a retail warehouse here in Salt Lake City. We can’t disclose the name of the retailer simply because we’ve worked closely with them. Regardless, this scenario could play out at any retailer, so the name doesn’t matter. We talked to a roving manager at an in-store kiosk about the details of her customers’ everyday experience. After some basic conversation, we asked some hard-hitting questions.
If a consumer doesn’t buy from you, which competitors do they buy from and, more importantly, why? She didn’t know.
At what point in the pre-sales process do customers churn out and what are the primary emotional and cognitive drivers? She didn’t know that either.
We decided to throw her a soft pitch.
If a lead takes a brochure, how do you currently track that brochure to an online event? Nada.
Now, granted…we were there on a purpose to audit the frontline, but answers to questions such as these help businesses understand and thus better predict which customers will generate more revenue and profits. It’s an inherently complex task because there are myriad variables to consider at each stage of the bow tie funnel, including acquisition costs, offline ads, promotions, discounts and more. Even then, these are very quantitative data whereas much of the heavy lifting comes from mining qualitative patterns.
Patterns. Pattern recognition. Those are the keys to successful implementation of any data science initiative. Let’s drill down on this a bit: pattern recognition can be used to leverage data and analytics to predict where to make strategic changes. You must train your machine learning models to spot patterns against the backdrop of the most important, empathetic set of questions — the ones stemming from your buyer’s WHY — that ensure each micromoment within your data loop matches up against the opposing data loops (i.e. Journey Analytics, deals closed, deals lost, reactivated deals and more). In aligning these data sets effectively, you’re able to ensure correlation and make more strategic decisions.
Asking the right questions is probably the hardest part of this equation. Many organizations start by getting the main data scientist on the line to run some predictive models and find answers. While that might seem like a safe choice on the surface, we believe it’s a risky approach. Here’s why.
Consider a case in which IBM’s Watson machine learning more accurately diagnosed Kawasaki’s Disease, a potentially life-threatening disease of the heart, before physicians could. In this case study, a 9-year-old boy visited the emergency room with a high fever and a lump on his neck. Physicians focused on the high fever, made their diagnosis based on their initial cognitive biases and prescribed antibiotics. But, after six days of failed attempts at curing the boy, the physicians used a machine learning model to make the diagnosis. In doing so, they very quickly determined that the boy had the obscure Kawasaki’s disease. The machine learning model was able to hone in on the disease because it was not distracted by inevitable human associations and predeterminate bias. The same is true for you and your team as you try to filter out opportunities to increase the LTV of your customers.
When data scientists approach data, they come with a loaded gun of biases, which infiltrate their logic and determine the location of their target. They drive the data toward what they want, instead of letting the data give insights about what your end consumer truly wants. To overcome that human bias in business, many organizations rely on LTV machine learning models to predict which customers yield the highest LTV. By coding your machine learning model to become more insights-centric you can avoid these biases and avoid falling into the trap of using data as an absolute in your decision making.
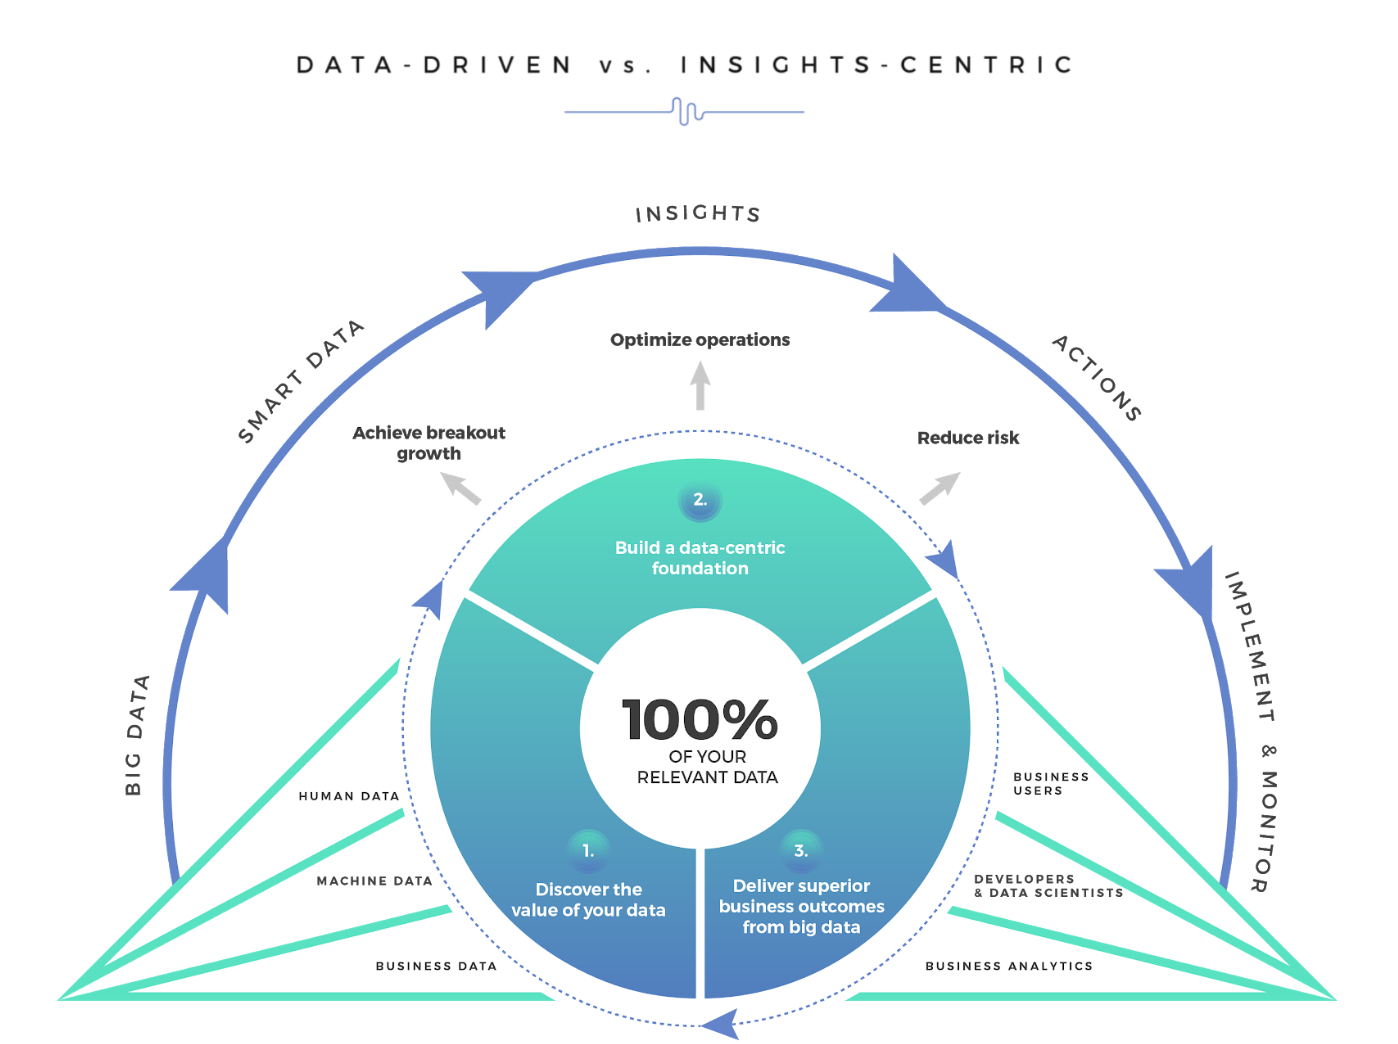
Remember our discussion about the importance of asking the right questions? When you ask why a customer does something instead of what they want, you’re able to become more insights-centric, letting your machine learning model pull out the answers to the most critical questions impacting your organization without letting faults in data or human bias skew the results. These “why” questions include:
- Why are customers buying from you?
- Why are they leaving?
- Why are they talking about you?
- Why is the market shifting?
There are many different data points that go into answering these questions and predicting LTV. You’re looking at data from across the entire customer journey funnel, which means you need to ensure each data point you’re using serves a purpose. When considering your fit statistics (remember those from above?) you’ll want to use adjusted R2 here. R2 tells you how well the data points fit a curve or a line. Adjusted R2 adapts to the model. If it’s higher than the curve, you’re using more useful variables. If it’s lower, you’re using less useful variables and can probably eliminate some fluff.
There are also several different LTV-based predictive models, each with their own pros and cons. At RocketSource, we lean into behavior-driven models to get a better understanding of what’s happening at the user-level.
Building and innovating brand experience requires that you understand what’s happening in both the employee’s and customer’s worlds. To do this, you must ask your salespeople to figure out what’s happening along the path-to-purchase and determine how those actions align with the demographics and psychographics of the customer. Then, you can blend that data and quickly cut to the chase of data science to quantify the answer behind why people don’t stay in the funnel, which is the ‘why’ moment we talk about in detail in StoryVesting. With these factors in mind you can build out a behavior-driven retention model to make user-level predictions.
Behavior-driven machine learning models leverage quantitative and qualitative data to predict which users will have a higher LTV.
Behavior-driven models are complex to set up. These models rely on a significant amount of qualitative and quantitative data such as engagement data, conversations with sales teams and more. Once the necessary data has been gathered, data science teams can use regressions and machine learning models to understand which actions, or action combinations, are the best predictors of a user’s value. Once a model can uncover patterns in how a person uses a product, teams can then uncover new opportunities to deliver better experiences and ratchet up the LTV of more cohorts of customers.
4. Employee Retention Model
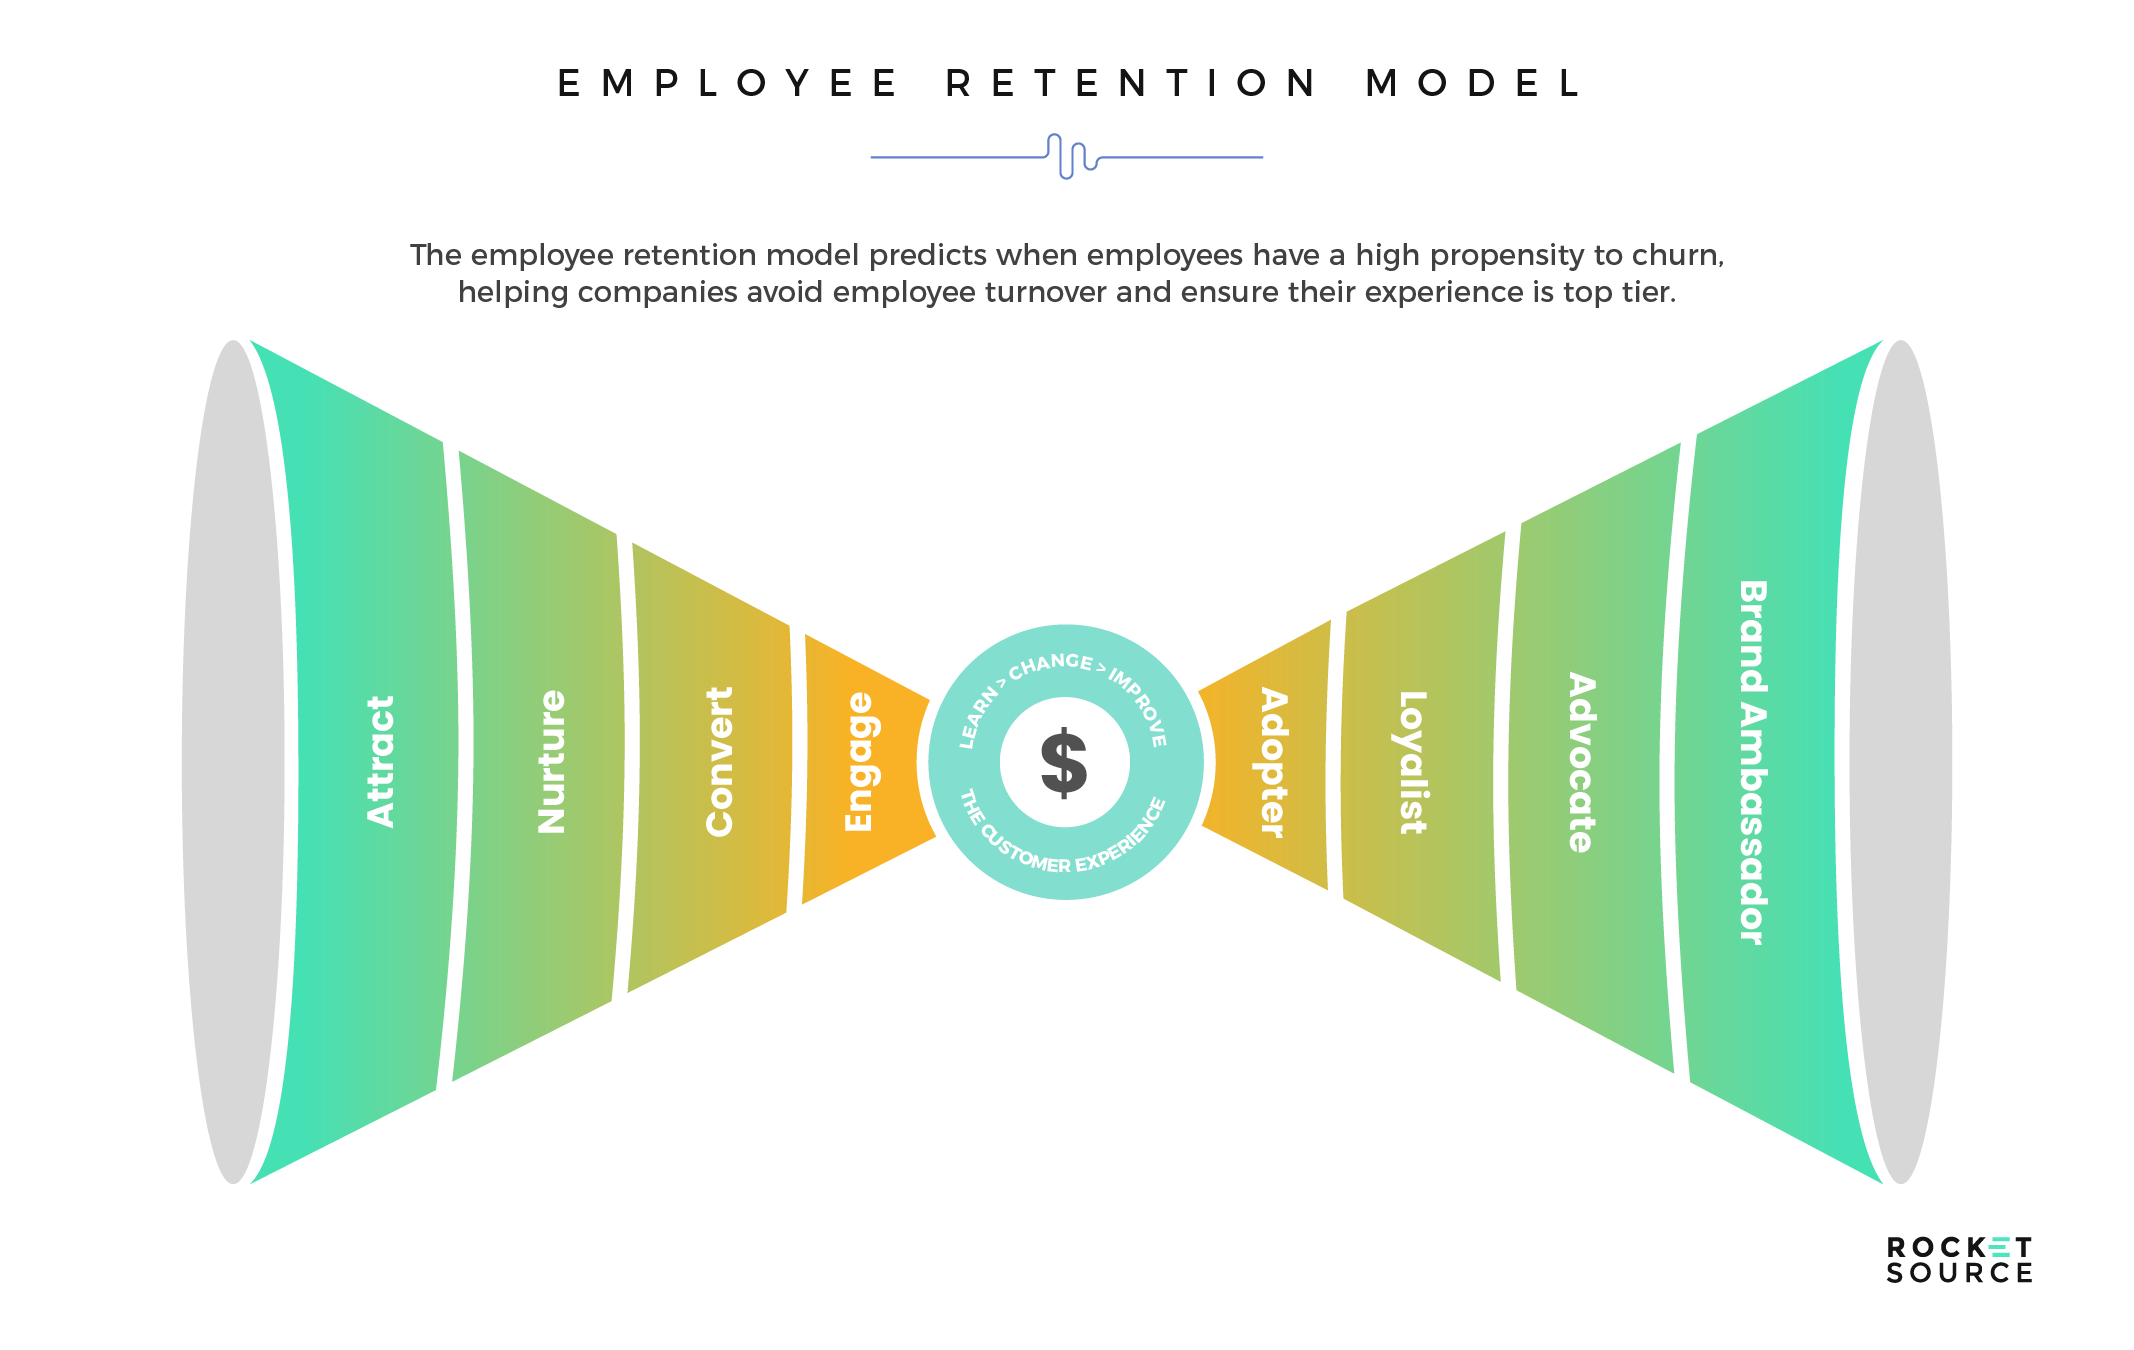
No matter how many employees you have turnover happens, and the dollar cost of employee turnover is much higher than many realize. It costs about 50% of an entry-level employee’s salary, 125% of a mid-level employee’s salary and 200% of an executive’s salary just to replace that employee. Interviews, sign-on bonuses and lost productivity are enough to quickly skyrocket the costs associated with losing a team member. Not only that, the brand experience (BX) is directly affected by the cross-pollinated experiences of both employee experience (EX) and customer experience (CX). In terms of correlation, we can map out and pinpoint the exact areas and friction points brands must rectify in order to stay competitive and decrease the propensity for employees to churn metric while at the same time strengthening areas that are key to employee retention. All of this modeling is based on sophisticated and intelligent data looping processes that can be championed by every single layer of an organization.
Having a machine learning model in place to help boost retention via predictive analytics is one of the biggest assets any organization can have in their back pocket. We know because we recently had the honor and privilege of working with Elisa Garn, Vice President of Human Resources and Talent for Christopherson Business Travel and one of the most forward-thinking executives on the planet. She and her team went through our LevelNext MasterClass Workshop on Modern Business Transformation with the goal of understanding how to lay the foundation for boosting retention via the core components we teach during these workshops. These components included our modified Hoshin process methodology and empathy mapping, as well as customer and employee journey analytics.
Garn’s company attended this training with a clear goal — building out and refining their company vision to ensure brand stickiness at the employee level. The goal in doing this was to align their employees with their customers and improve the overall experience while lowering their propensity to churn. Here’s what Garn had to say about how she’s applied her learning to improving employee retention.
In the past, she and her team used annual reviews and exit interviews to determine engagement and identify problem areas. The problem with this approach is that, by the time they got the data they needed, it was often too late. They needed a way to find the employees at risk of leaving and target those employees with incentives that would drive them to stay. Using employee journey analytics specifically, we were able to help her and her team decipher a few critical factors:
- The employee’s propensity to churn
- How that propensity to churn will impact the customer’s experience
- How the impact of the customer’s experience will affect top-line revenues and bottom line profits
Garn and her team brought back what they learned to their CEO and are now ideating the best ways to articulate their vision to improve employee experiences and reduce churn. They’re now equipped to start leveraging their data to get answers to some of the hardest questions they encounter. By tracking who has a higher propensity to churn, Garn and her team can intervene before they talk to an employee during an exit interview and subsequently increase the odds of retaining their top talent.
Like Garn’s company, many organizations already have a healthy amount of data about their employees, including demographics and psychographics. For a propensity to churn model, some of the most critical factors to analyze include:
- Monthly income
- Overtime
- Age
- Distance from home
- Total working years
- Years at the company
- Years with the current manager
By running predictive analytics using this data, organizations are able to leverage machine learning models to identify patterns and highlight the employees with the highest propensity to churn. This trips a wire in the human resources department, notifying them to reach out and rectify the concern before it’s too late. For example, if there’s a higher propensity to churn after a move further away from the office, the human resources office can reach out and offer the employee the opportunity to telecommute a few times a week.
As the company continues to get data from employees joining or leaving the team, the algorithm can be retrained to become more accurate over time. Human Resources departments can then use the data to craft a more strategic retention plan for low, middle and high-risk employees, helping improve work conditions before it’s too late. Having these analytics and a model to quickly identify team members at risk of leaving is critical to proactively engage and retain valued employees.
The Ability to Predict is a Massive Competitive Advantage
Building these models is just the first step. But it’s not enough to put these four models in production and call it a day. Once built, you need to know how to interpret the findings and disseminate the knowledge from these models throughout your organization. That’s no easy feat, especially given the world we live in today in which silo walls stunt internal communication. Data science and analytic experts, for their part, need to not only realize the gap between bleeding-edge science and an organization’s ability to actually implement working models, but they must take an active role in closing implementation gaps so that each initiative can truly be operationalized.
If organizations expect to get tangible value from machine learning, they need to focus not just on technology, but on a holistic set of frameworks rooted primarily in human-centered design, forward-thinking empathy, deeply rooted behavioral psychology and agile and lean process improvement. Without a doubt, machine learning is a powerful tool for building transformation, but in order to use this asset most effectively, you need to know where to start and have the viable frameworks with which to manage the insights available.
We can confidently say that, with our insights-centric frameworks and the four most crucial machine learning models in place, you’ll be on the right course toward meeting your organizational goals and achieving attributable and transformative influence from modern technology.
RocketSource helps transform the potential of predictive analytics into tangible business results by putting intelligent analytics at the core of business function rather than treating it as a separate R&D initiative. Doing so has a transformative and insulating influence on how organizations run their business, redefine their workforce, refine their operational efficiencies at scale, innovate and reimagine their products and services, create immersive employee and customer experiences and much, much more. Modern businesses and team leaders no longer seek answers to questions that, yesterday, seemed so normal to ask. Instead, they want to know what is likely to happen tomorrow. They want to make insights-driven predictive decisions quickly and easily, which is the promise that what RocketSource delivers — not as a horse and buggy shop — but as a transformation and innovation partner.